Global Macro

Over the last three weeks, the USD has gained more than 6% versus the Japanese Yen, nearly 4% against the Euro and USD Index has reached its highest level in over 13 years at 102.10. Further, the US SP 500 and Dow Jones 30 both pushed into new record territory. But the strong surge in the Greenback and US Stocks met resistance last Friday with the G-7 pairs closing well away from the best levels on the session. This pullback has FX strategists wondering if the US equity run is over and it’s time to sell the US Dollar.

Statistically, there is no question that the US Dollar has gotten ahead of reality and a correction of some degree is reasonable. However, it’s important to recognize that the sharp rally in the USD and US Stocks, along with surge in US Bond yields has been driven by 3 fundamental factors: position adjustments to USD and US rates, the prospects of an aggressive fiscal program from the new US administration and the expected impact of higher US inflation.

Along this line of thinking, the US FED FUNDS futures have fully priced in an adjustment higher in the FED Funds target next month to .75% and nearly a 40% chance of another 25 basis point hike by May of 2017. With the second rate hike not expected until the middle of next year, the USD and US Stocks could take another leg higher if the FOMC statement suggests that further rate normalization could come sooner.

This means that the USD correction could be swift and unbalanced across the G-7 pairs. For example, a large percentage of the USD/JPY rally has been driven by US yield spreads gaining against Japanese Government bonds. This is not the case for the sell off in the AUD and the EURO. The Euro faces a list of political and economic troubles which should keep the pair under pressure going into the end of the year. Which brings us to the Sterling; which has firmed against the USD over the last few sessions.

The GBP/USD looks to be setting up for a breakout after consolidating over the last week. The big story driving the Sterling last week was UK Chancellor Hammond’s comments about the budget. While Mr Hammond lowered his growth forecasts for the next two years, he promised more borrowing and investment into innovation and infrastructure. He also announced a new National Productivity Investment fund of £23 billion and plans to double UK export finance to make it easier for British businesses to export.

These new spending plans were not expected which pushed the EUR/GBP sharply lower and lifted the FTSE 100 to its highest close in two weeks. With respect to Brexit politics, Prime Minister May repeated her plans to trigger article 50 by march of 2017 and exit the European Union by March of 2019. As such, we believe that the Sterling will outperform the Euro, USD and the other G-7 currencies over the near-term as the USD and US Stocks correct lower.
Amcor – Price Target Update

The recent rally from $13.60 to $15.00 may be the best upside performance we see in Amcor for a while. Some analysts are downgrading Amcor from “outperform” to “neutral” as the company’s defensive revenue stream isn’t likely to expand as higher global interest rates affect their expense line and cost of capital calculation. This includes the impact of the USD appreciation against the EURO lowering EPS by about 5%.

With its large US and European asset base, Amcor has been able to maintain lower borrowing costs. However, with Weighted Average Capital Costs, (WACC), increasing from 6.6% to 7.1% in FY 17, bottom line profit growth may not be able to keep pace with rising interest rate. 

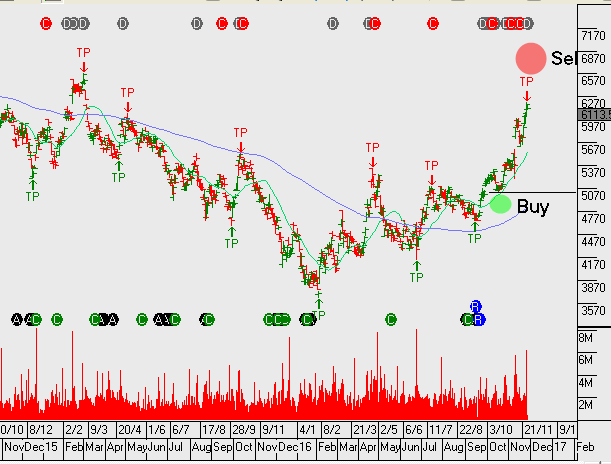
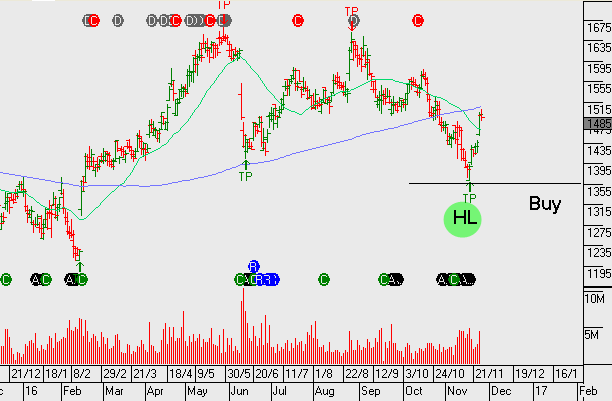
We see the price impact reflected in the lower high and lower low technical structure in the Amcor chart.  Whilst we don’t expect aggressive upside share price targets, we still feel owning AMC and selling covered calls to generate 10% annual cash flow from the dividend and call option premium makes sense.

The trading range is now $14 to $15.50 and investors should consider locking in gains at the top of the range, (or delivering the stock under the call option at $15.50 strike) and looking to buy the stock back on any pullbacks to $14.00.

Chart - AMC
Chart – AMC


Key Australian Data Points

After several weeks of following US and European economic reports, Australian investors will get the chance to see how the domestic economy is performing into the end of the year.

This week’s key data points include Building Approvals and New Home Sales on Wednesday, then the quarterly CAPEX reading on Thursday, followed by the Monthly Retails Sales data on Friday.

The Building and New Home sales data have been steady over the last six months and have not offered any surprises which the RBA have had to respond. This week’s data is expected to show that building approvals have bounced back from last month’s 8.7% decline and the sales of new homes is in the 3% range.

The CAPEX and Retail Sales data are a different story. These two data points have been diverging over the last 12 months. Friday’s retail sales report is called .3% higher, which would be the third consecutive monthly increase. On the other hand, the quarterly CAPEX data is expected to show a 2.8% decline reflect the third consecutive quarter of weaker Capital Outlays and the 7th quarter of the last 8 quarters.

From an interest rate policy perspective, the CAPEX data has the greatest potential to move the market.


BHP & RIO – Iron Ore Price Update

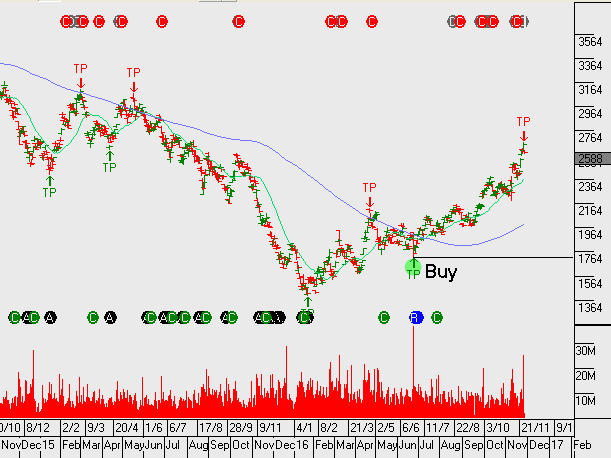
Iron Ore prices continued its two month rally last Friday and trading close to the $80.00 per ton level for the first time in over two years. According to spot metals pricing, the benchmark 62% fine rose another 3.5% to 79.60 on Friday, extending its four-day rally to an impressive 13.2%.

The benchmark price has now gained over 82% so far in 2016, and has risen 108% from the all-time low of $38.30 per ton posted on December 11, 2015. The rally corresponds to the news that Chinese policymakers had managed to remove 88 million tons of steelmaking capacity across the country since the beginning of the year.

This has help trigger gains in steel prices, along with Iron Ore.

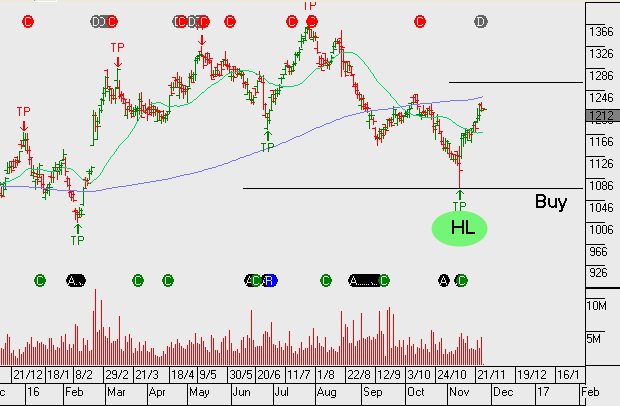
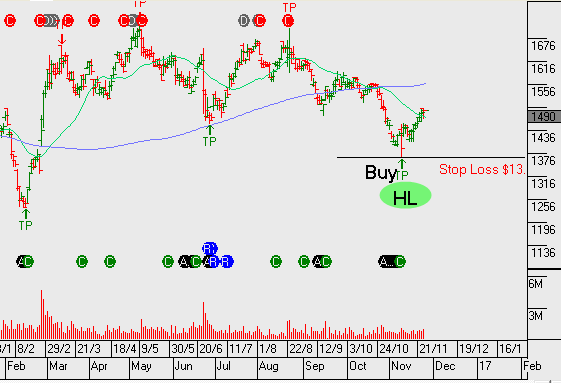
BHP and RIO have performed well, we look to keep exposure to these names and add to the cash flow through selling covered call options.

Chart - RIO
Chart – RIO
Chart - BHP
Chart – BHP

Global Macro

The European Central Bank (ECB) meets on December 8th and they are widely expected to extend their asset purchases, as well as, modify their bond qualifications to expand the supply of eligible securities. With the Italian referendum scheduled for December 4th, it’s  becoming very clear that the ECB’s stimulus program, and how it evolves, is changing from an economic strategy to a political necessity.

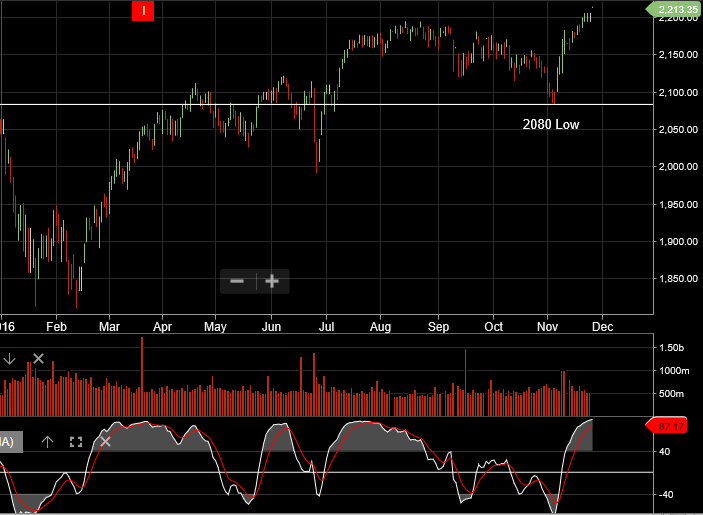
On the other side of the Atlantic, the SP 500 Index has traded sharply higher over the last two weeks. The Index  has jumped to a new all-time high of 2207.00. The new administration’s commitment to tax reform, fiscal stimulus and repealing the Dodd-Frank legislation has drawn investment capital from both domestic and overseas investors.

Taking into account the Non-farm payroll data next week, followed by the ECB meeting the following week and then the FOMC meeting, we’ll be monitoring closely the momentum signals in the major global equity indices.

Chart - SP500
Chart – SP500

XJO – Momentum Indicators Still Positive

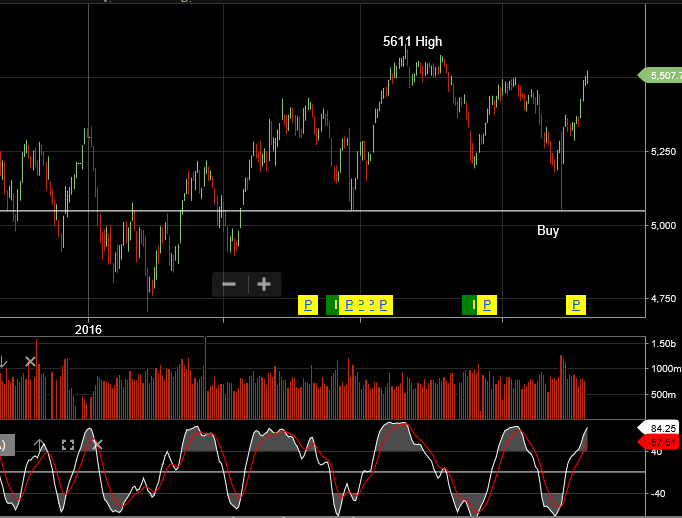
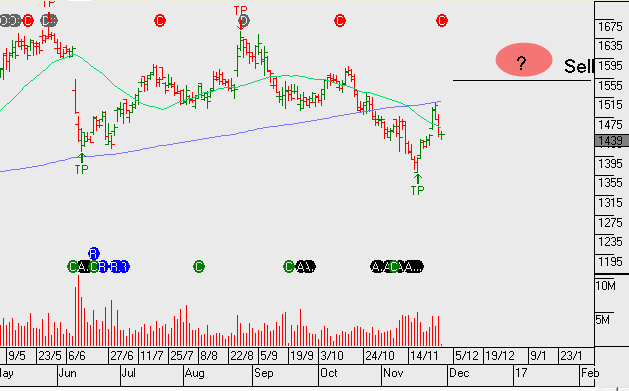
Our algo engine is flagging the lower high technical structure in the ASX 200 index (XJO) and a number of the stocks making up the index are also displaying a similar set up. The resources are the driving force behind the index rally and any attempt to short the market or the index needs to be built upon a view that the big cap resources have exhausted their current rally.

Whilst we’re watching the above and looking for further confirmation, we’re not quite there with regards to changing our existing “long market bias”.

The following chart of the XJO shows the index approaching the previous high of 5611 points (set on 1/8/16). The momentum indicators still remain positive at this stage.

Chart - XJO
Chart – XJO


BXB – Running into Resistance

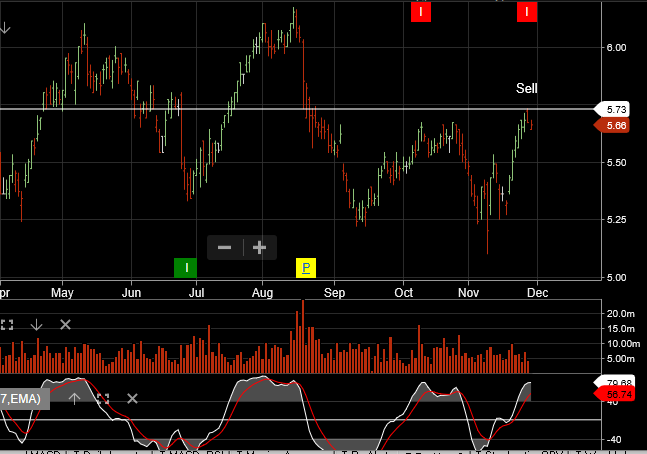
We’ve been buyers of BXB on the recent low and are now mindful the stock has rallied almost 10% from its lows and on a valuation basis the share price is likely to run into selling pressure around $12.50.

At $12.50 it places BXB on a forward yield of 2.5%, assuming management delivers 8% underlying EPS growth. From a technical perspective, the algo engine is now flagging the lower high formation which we take as a signal to either lock-in short term profits, or for longer term holders, sell covered calls to enhance the cash flow yield.

Chart - Brambles
Chart – Brambles


Seek – Reaffirms Guidance for FY17

SEEK reaffirms guidance for FY17 underlying profit of A$215m-A$220m.

SEEK was able to maintain guidance for FY17 due to strong operational performance from most business units, despite unfavourable currency moves.

FY17 revenue $1.b, EBITDA $400m, EPS $0.60, DPS $0.40 places the stock a forward yield 2.8%.

We like Seek and see upside earnings potential, however, after entering long positions at the recent low, we now look to lock-in profit ahead of anticipated resistance, at or near $15.50

We’ll revisit new entry opportunities on the next algorithm signal.

Chart - Seek
Chart – Seek