Global Macro

At this point, the FED Funds futures market is pricing in a 95% certainty of an upward adjustment to the Fed Funds target and a 40% chance of another adjustment by May of 2017.

Sunday will be the Presidential elections in Austria and the Parliamentary referendum in Italy. Between these two events, it’s more likely to expect a market moving result from the elections in Austria. If the Italian people vote “No” to the constitutional changes proposed on the ballot, the worst case result is that PM Matteo Renzi will be replaced by some other non-elected technocrat designated by the EU.

However, if the Freedom Party leader, Norbert Hofer, is elected as the next president of Austria, his promises to hold a “Brexit” style referendum, combined with his general disdain for EU policymakers in Brussels, could pressure G-7 equity markets lower.

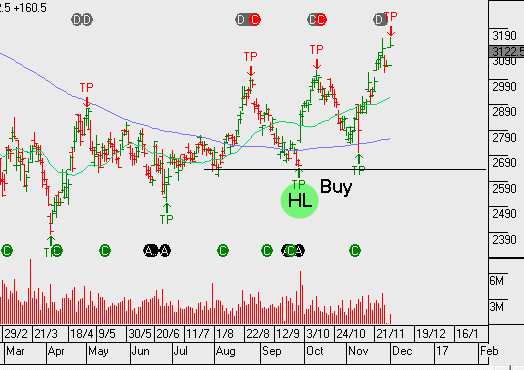
USD and US Stock indexes look technically stretched; internal volume and “breadth of market” indicators are showing signs of rolling over. It seems the slightest fundamental disruption to the current expansionary theme could trigger a pullback.
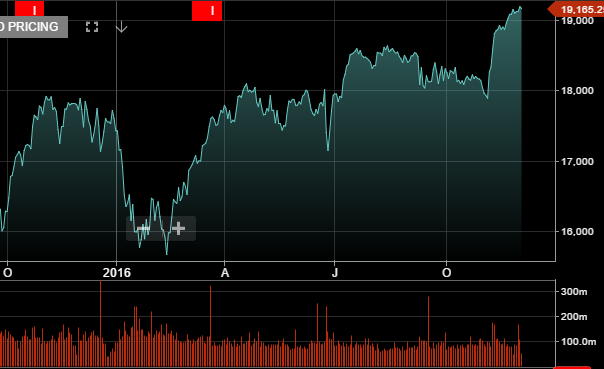
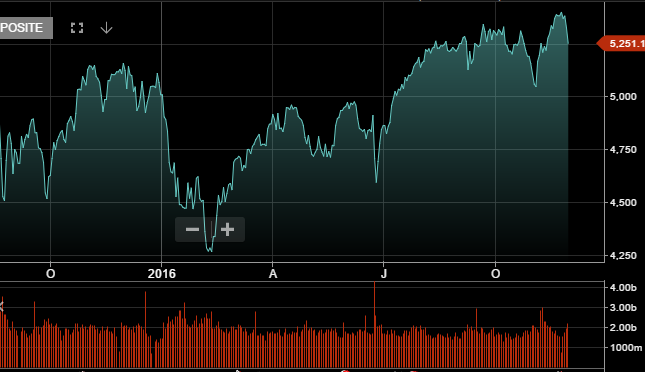
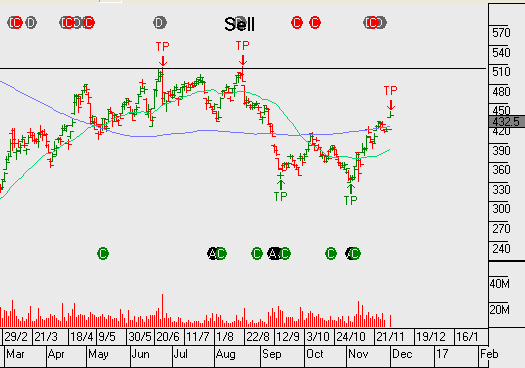
Chart - Dow Jones Index
Chart – Dow Jones Index
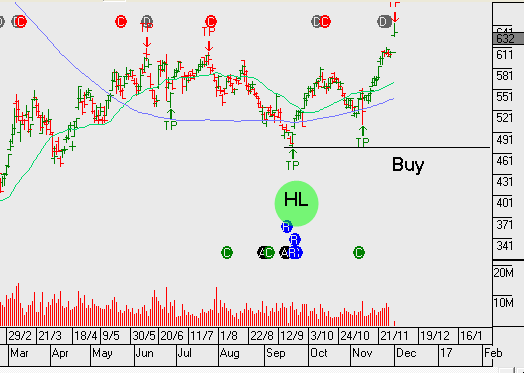
Chart - NASDAQ Index
Chart – NASDAQ Index

US Banks vs Technolgy

Over the last five years, one of the least important concerns for US Corporate Treasurers has been the forward cost of funding. However, over the last two months, the sharp rise across the US Treasury curve has exposed some notable differences in how banks perform versus technology companies perform in a rising interest rate environment.

Since October 1st, the yield on the US 10-year note has surged close to 90 basis points from 1.55% to 2.44%. This is nearly a 60% increase and has helped US banking stocks, while hurting some big technology names.

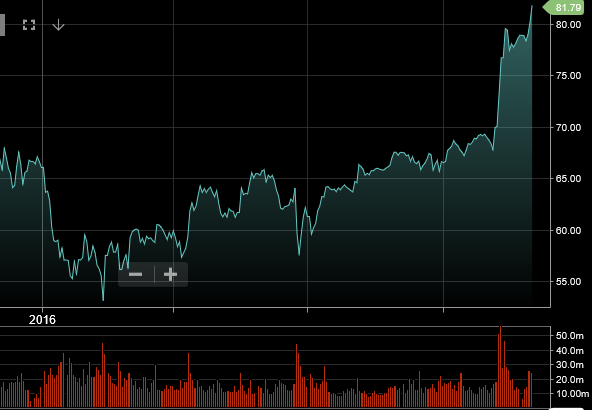
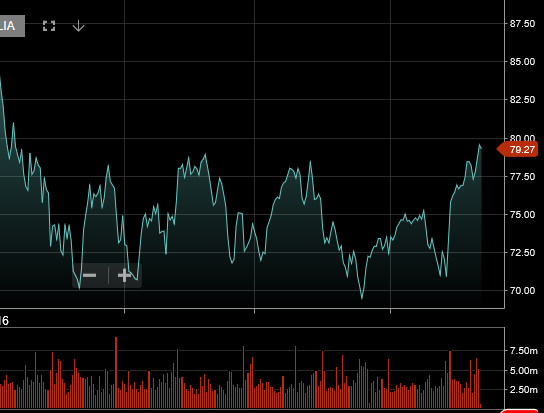
For example, Since October 1st, shares of J.P.Morgan have climbed over 20% from $67.00 per share to over $81.00 per share. During that same period of time, shares of Facebook have dropped from $133.00 per share to just under $115.00 per share; a 13.5% drop.

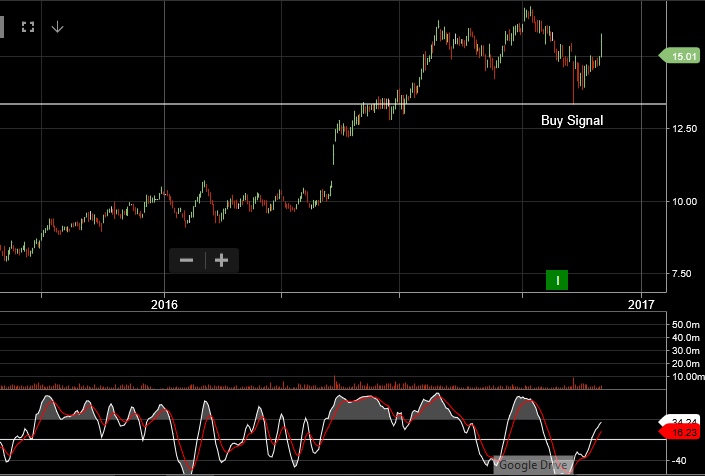
Chart - JP Morgan
Chart – JP Morgan


Australian Banks – Credit Growth

Australian consumers borrowed less in the month of October with RBA data showing private credit growth at 0.5% (5.3% year on year) versus a YoY rate of 5.4% last month. A closer look at the data suggests Australians are interested in buying real estate and not much else. Even though housing credit growth was flat last month at 6.4%, the pace is still well above the 4.4% growth in Business credit and the rate of Personal credit; which actually dropped to -1.1% Year on year.  It’s likely that the growth in housing credit has been supported by the RBA’s rate cuts in May and August. However, the RBA won’t miss the fact that lending over the last 12 months has a flat to lower trajectory, which may influence their policy directives going forward.

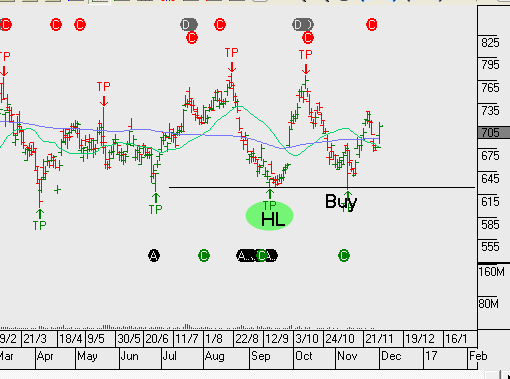
Australian banks continue to push up against the top end of the their price channels. We’re mindful of the rally in US banks helping to boost investor sentiment towards the sector, yet there is limited evidence domestically  of any pickup in earnings on the horizon.

Chart - CBA
Chart – CBA

Oil Prices Surge 10%

Crude Oil prices surged as much as 10%, almost reaching the $50.00 mark, as the Organization of Petroleum Exporting Countries (OPEC) agreed to curb oil production for the first time since 2008 in an effort to reduce oversupply and support prices.

The 14 nation cartel, led by Saudi Arabia, agreed to cut production to 32.5 million barrels per day, which pencils out to a 1.2 million barrel per day reduction from current levels. Saudi Arabia agreed to take the lion’s share of the cut; lowering their daily production by 486,000 barrels per day to get the deal done.

Russia, the world’s largest Non-OPEC producer, had long resisted cutting output but has tentatively agreed to join the effort by reducing production by 300,000 barrels per day. OPEC will meet with Non-OPEC producers on December 9th.

If history is an accurate gauge, the bullish market response to this deal may be short lived. OPEC members haven’t shown a strong track record of compliance to previous production agreements. As such, the recent price action in Crude Oil could reverse over the near term as more details are released.    

Chart - Woodside
Chart – Woodside
Chart - Oil Search
Chart – Oil Search
Chart - Santos
Chart – Santos
Chart - Origin
Chart – Origin


Aristocrat Leisure – FY16 Earnings

Aristocrat Leisure posted strong FY 2016 results with top-line net profits surging more than 67% to $398 million compared to a year ago. This result was well in front of the consensus forecast of $376 million and reflects strong growth in both the US and Australian markets.

However, as impressive as the headline numbers for the 2015 to 2016 time frame appear, some of the internal figures suggest the growth in share the price may not repeat in 2017. With dividend growth expected to increase from 20.5 cents per share in 2016, to 24.6 cents per share in 2017, the total dividend yield is expected at 1.7%.

With EBIT expected to rise from $605 million to $674 million, this small increase in expected dividends is making Aristocrat look expensive at current levels.

Chart - ALL
Chart – ALL

Australian Housing Data

The Housing Industry Association’s (HIA) monthly survey of Australia’s largest home builders indicates that new home sales dropped to a two year low during October. HIA announced that new home sales fell 8.5% for the month on the lowest volume since July of 2014.

Further details showed that sales on both sides of the market saw sizeable declines with detached house sales down 8.2%, while multi-unit sales fell by 9.2%.

This sharp decline in new homes sales will likely temper recent calls for the RBA to maintain a neutral interest rate bias.

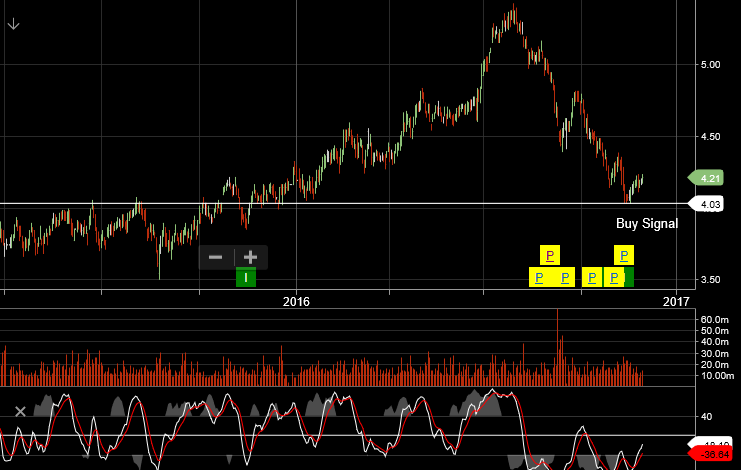
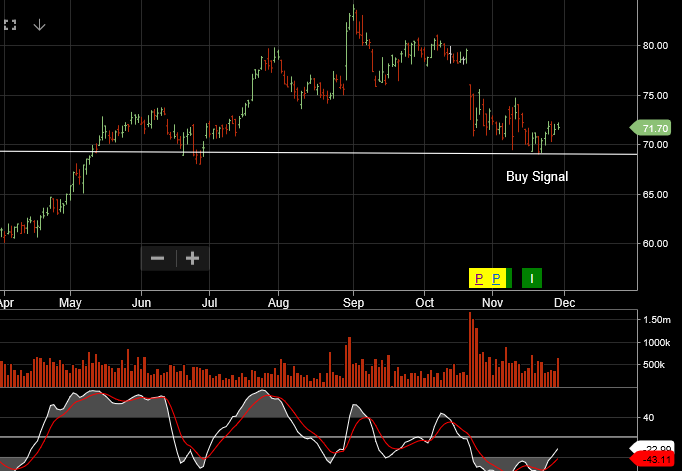
Scentre Group – Algo Engine Buy Signal

We’ve been tracking SCG and looking for the right entry point. With US bond yields running into resistance, we now feel money flow will continue to build in SCG, creating support and eventual price extension from the current $4.20 price point.

5.5% forward yield with 3% underlying EPS growth into FY17, makes SCG worth looking at, especially following our recent algo engine buy signal.

As the share price moves higher, at around $4.40, we look to sell the $4.50 covered calls with an April expiry. The April expiration date will allow us to collect the upcoming February dividend, as well. This strategy will boost the 6 month cash flow to over 5%, or 10%+ on an annualised basis. Plus allowing for capital growth of 7%.


Chart - SCG
Chart – SCG