Will US “Stagflation” Be Bullish For Gold?
One of the main policy points from Wednesday’s FOMC meeting was that the US Central bank will accept an overshoot in inflation even if overall GDP growth starts to slow……..more commonly known as Stagflation.
Stagflation is an economic condition which is characterized by higher inflation and lower GDP and employment growth, which is not bullish for equity markets and not bearish for Gold.
Over the last 6-months, Gold has been trading in a broad pennant formation bound by $1365 on the topside and supported at $1300 at the lower end of the range.
Due to recent USD strength, the yellow metal is currently trading near the bottom end of the range near $1315.
If US inflation rates continue to probe higher, we expect the USD/Gold correlation to soften. In an inflationary environment, Gold and the USD usually move higher simultaneously.
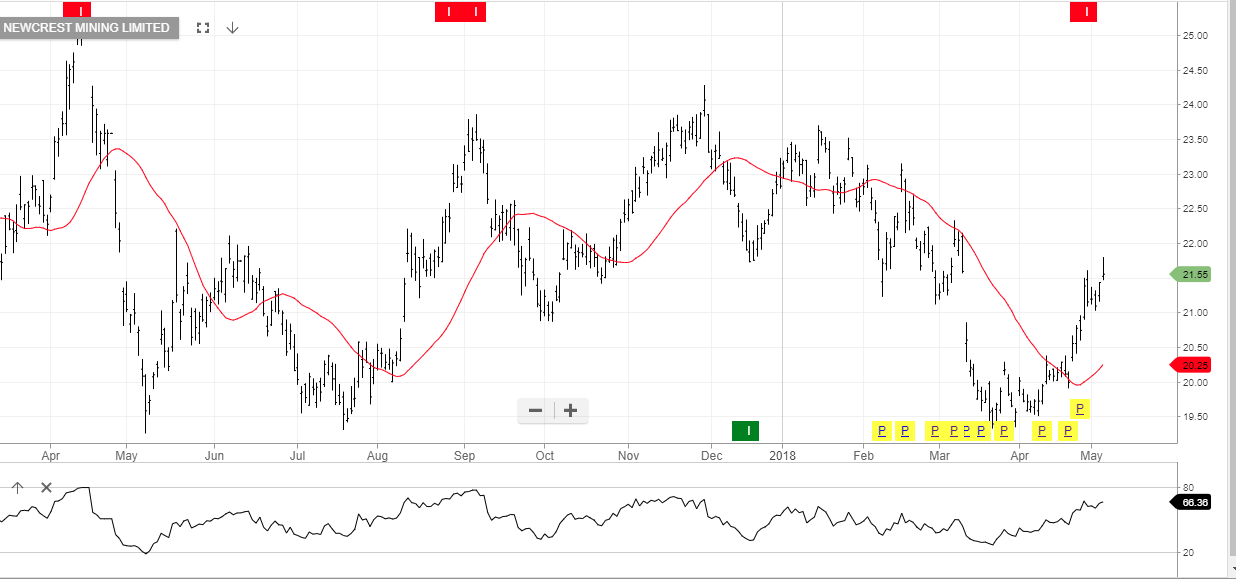
As illustrated in the charts below, the local gold mining stocks have been showing divergence with SBM, EVN and SAR near all-time highs, while NCM is trading at $21.55, almost $3.00 below its 52-week high.
Our base case is that Gold will rise over the medium-term, which should be supportive for the local mining names.
For more information on investment strategies within the Gold sector, call our office at 1-300-614-002.
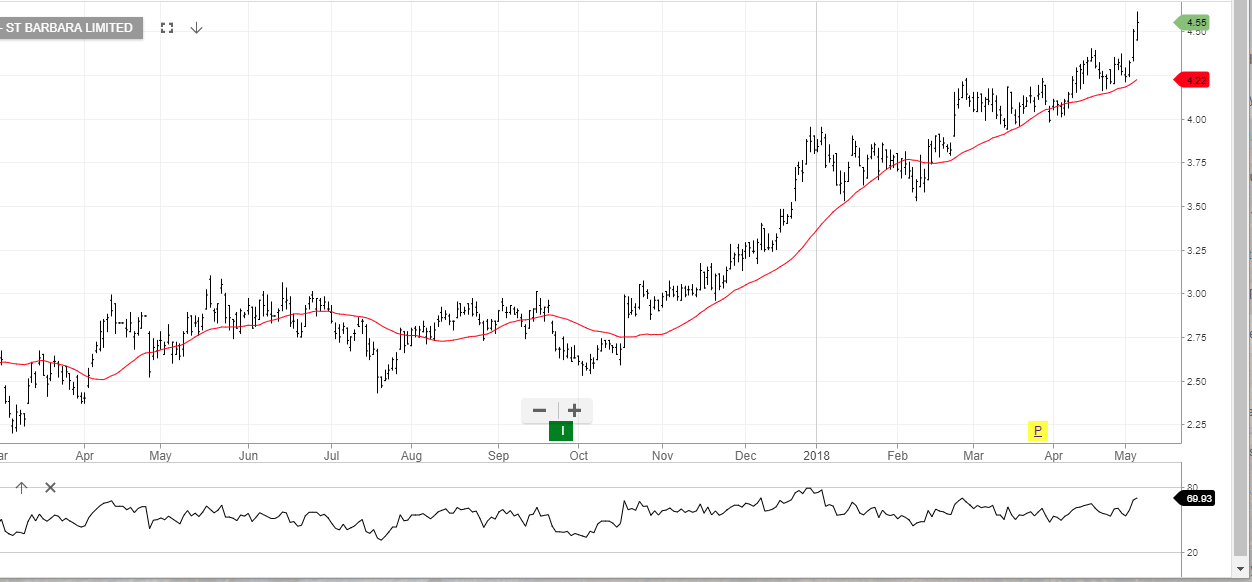
Santa Barbara Mines
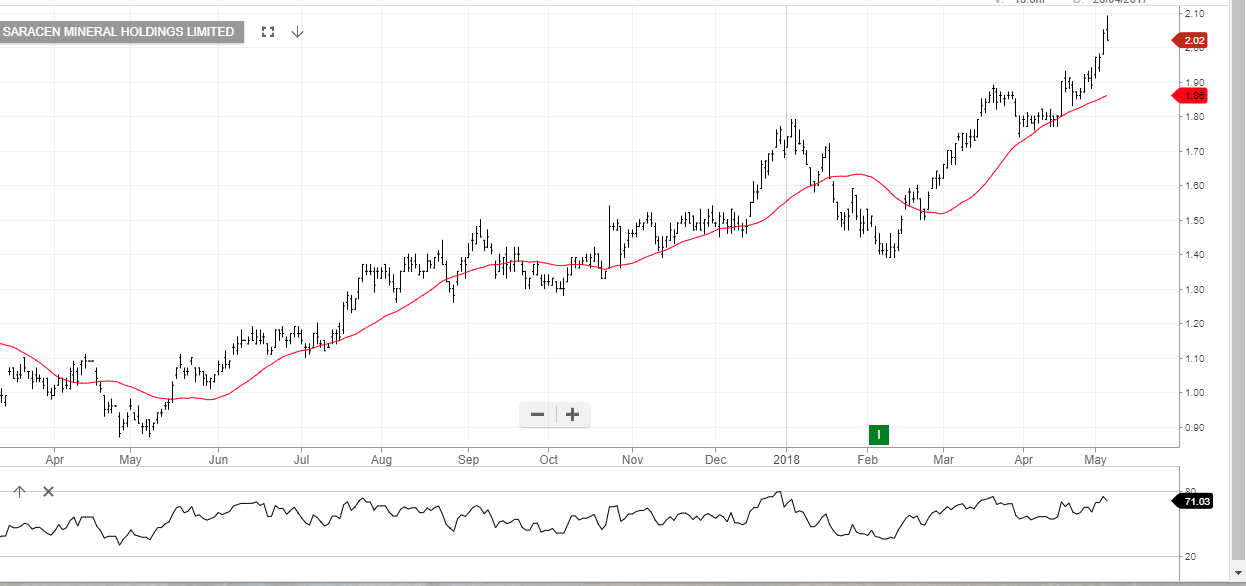
Saracens Mineral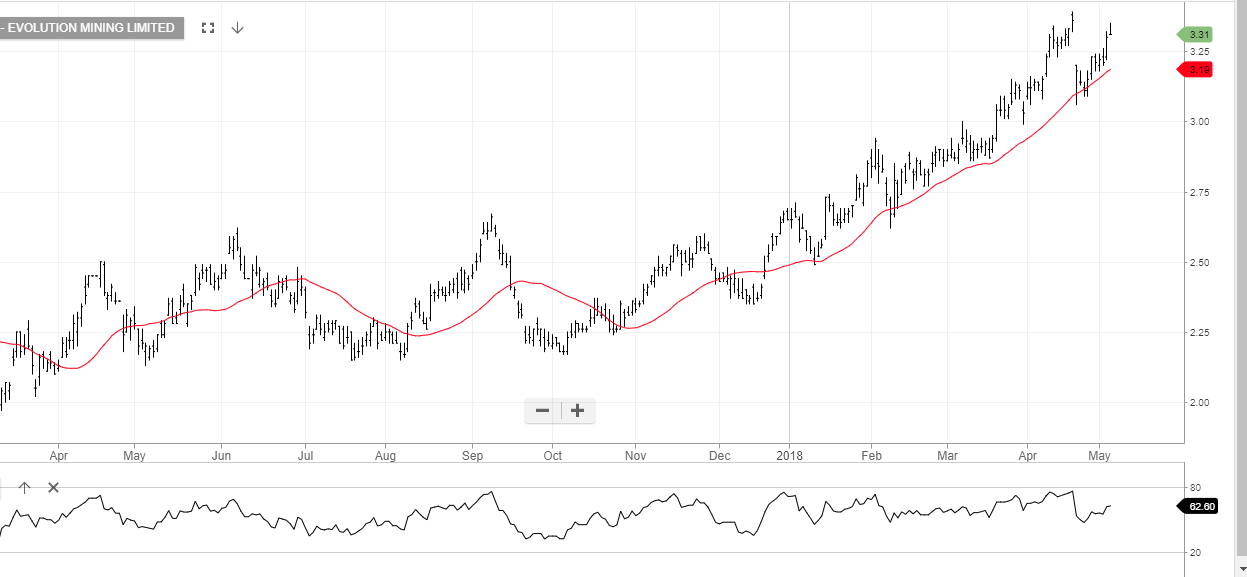
Evolution
Newcrest Mining
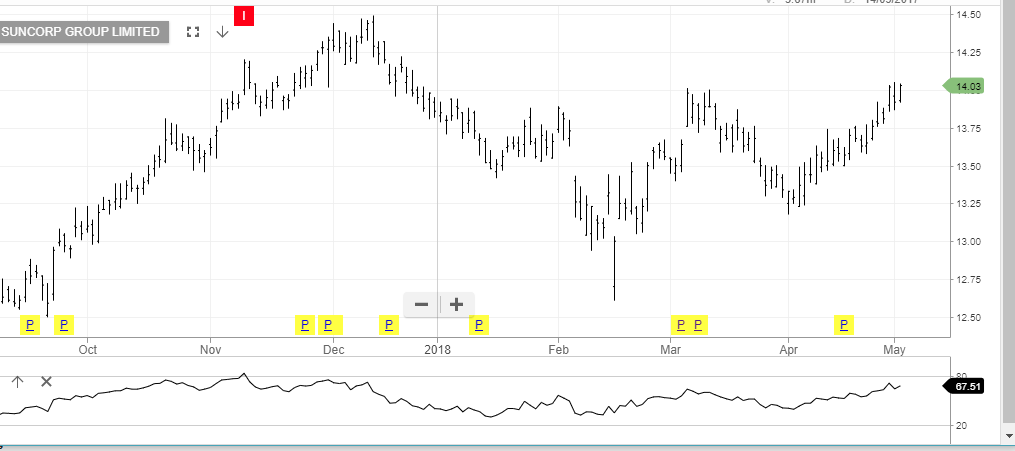
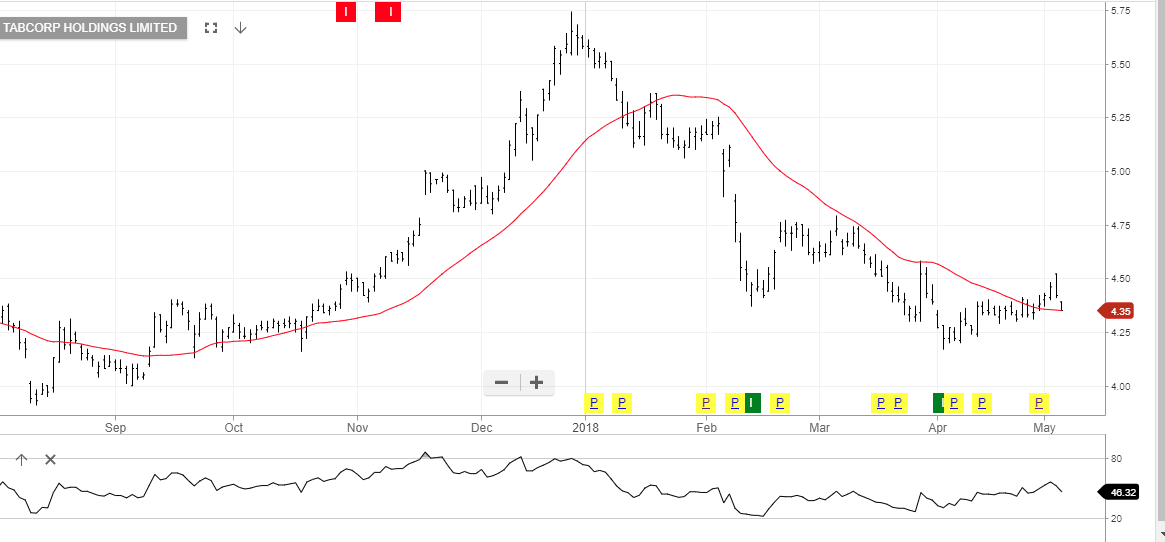 Tabcorp
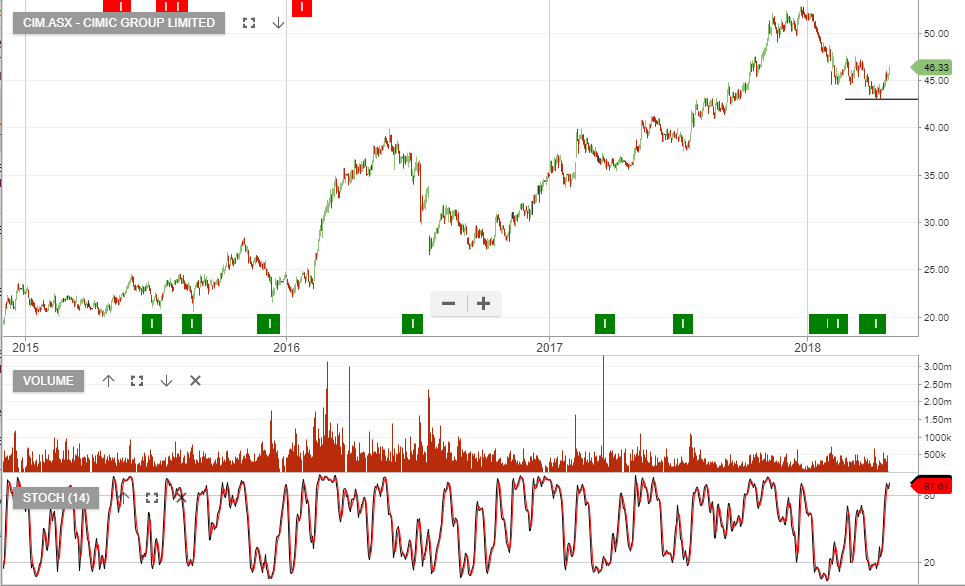 CIM
CIM