Algo Engine – Open Buy Signals

Below is a list of the current ASX top 50 stocks that have open buy signals from our ALGO engine.

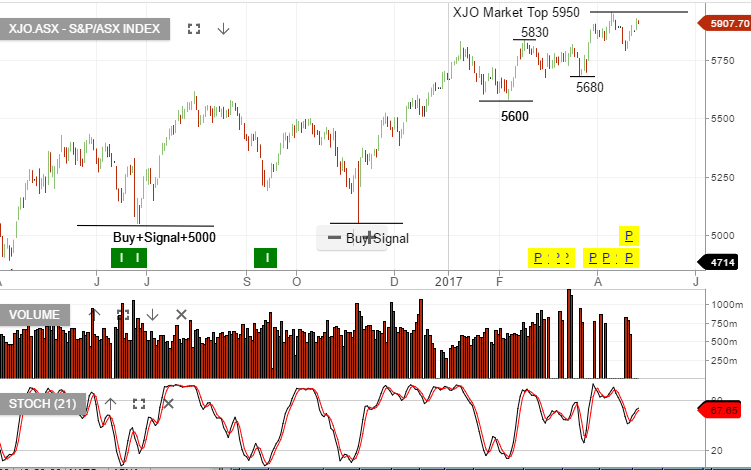
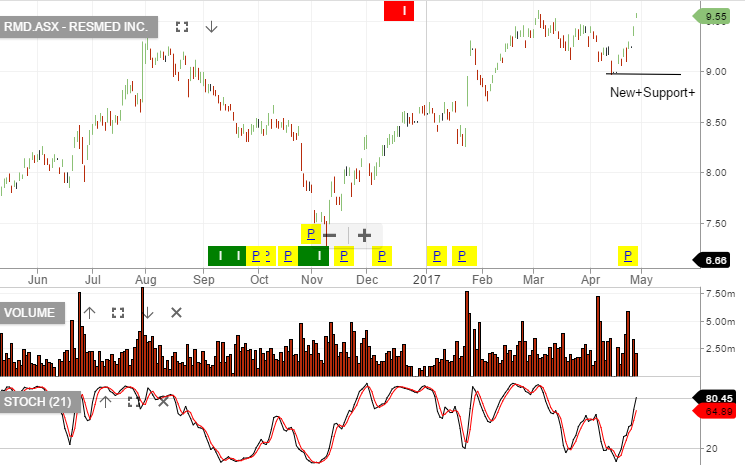
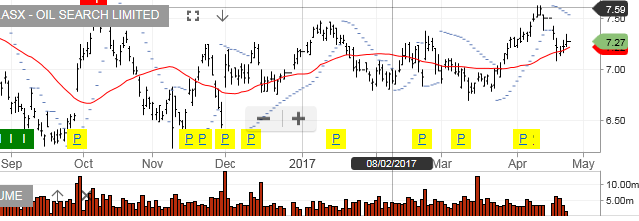
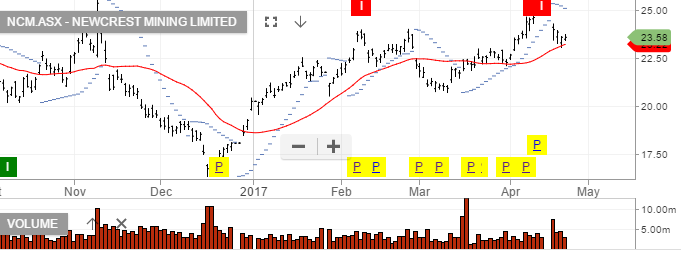
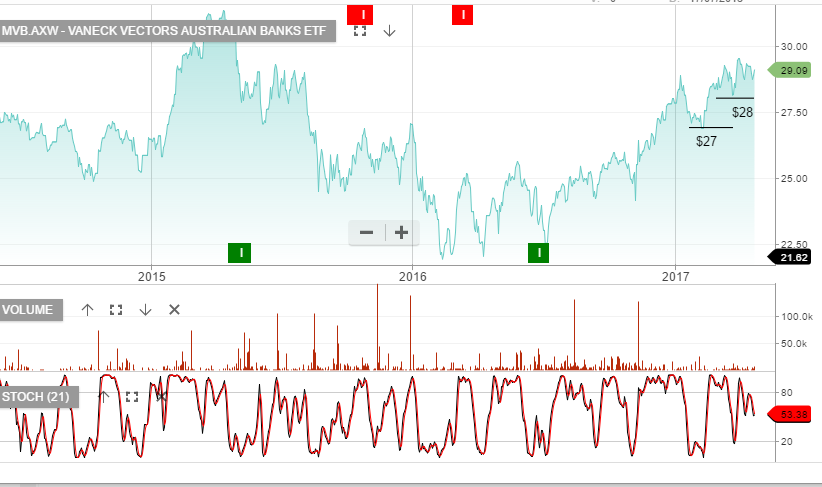
Some of these trends are maturing and are in the latter stages of their price expansion. However, taking the time to look through the charts and overlaying the ALGO Engine signals will be a worthwhile exercise.

TWE, WES, WOW, ALL, ANZ, ASX, AZJ, BHP, CSL, DXS, FMG

GMG, IAG, JHX, MQG, NAB, ORG, ORI, RIO,S32, SCG, SGP & SHL.

If your access to the charts and signals has expired, please contact me leon@investorsignals.com


Algo Engine – Preliminary Research

We have contracted a third-party firm to conduct a study on the ALGO Engine signals and trading model performance.

The preliminary results have supported my assumptions made by following 18 years of practical experience in the markets. The methodologies developed are now being integrated into a model using the following technical principles.

Our Algo Engine is capturing higher low buy points in individual stocks which make up the ASX top 50 index. When the XJO itself is making “higher highs” and “higher lows”, this produces a very high success rate.

Buying into these patterns can keep investors exposed to major bullish momentum without the human emotion of prematurely taking profits on the trade, and importantly,  automating the stop-loss when the upward price momentum begins to reverse.

The chart below shows the performance of the “long only” ALGO Engine signals. The model is based on buying $50k in all long signals and holding the long position until a subsequent short or sell signal is triggered.

An example of this logic is also displayed on the individual stock sample below using Amcor.

For a comprehensive copy of our preliminary research paper, please contact me on leon@investorsignals.com


Chart – Algo Engine Amcor History
Chart – Algo Engine Equity Return
Chart – Algo Engine XJO Benchmark


Take Profits In Suncorp

The ALGO engine gave us a buy signal on Suncorp on January 23rd at $12.92. Yesterday, the ALGO engine generated a sell signal at $13.77.

We suggest that investors who took advantage of the buy signal use this recent price increase to take profits or write covered calls above $14.00.

Technically, the $14.00 level has proved stiff resistance dating back to January of 2015.

Furthermore, the ALGO engine has generated exceptional signals for capturing the medium-term trading ranges for Suncorp.

Suncorp


AUD Slips Lower After Neutral CPI Data

Inflation in Australia remains flat, and below the lower end of the 2% to 3% RBA target band.

Many analysts were expecting an uptick in the CPI inflation reading to 2.3%, which could prompt the RBA to shift its neutral-bias to a tighter posture.

As a result, the AUD/USD fell to  a 3-month low of .7455 overnight. With the RBA meeting next week, any mention of a more benign inflation outlook would put more downside pressure on the Aussie.

Internal price indicators now point the the next support level at .7420 and a more significant target of .7365 over the near-term.

Over the last few weeks, we have been suggesting that investors look to buy the BetaShares YANK ETF to profit from a falling AUD/USD.

The YANK is an inverse ETF, with a 2.5% weighting. This means that YANK will gain 2.5% for every 1% drop in the AUD/USD.

Oil Search Points Lower On Weaker Crude Prices

After falling over 7% last week, WTI Crude Oil dropped another 1% last night to trade at a four-week low of $49.05.

Concerns of oversupply in both Crude and Gasoline are dragging prices down as both products are now trading below their 30 and 50-day moving averages.

This weakness in both the technical and fundamental indicators will likely put downside pressure on the shares of Oil Search.

On April 19th, Oil Search announced a quarterly report which showed a 2% decline in total production for the March quarter, along with a 1% decline in total sales revenue.

Based on these data sets, we would expect OSH shares to trade back down to the initial support at $6.70 in the near term.

Oil Search

Newcrest Is Back In The Buy Zone

The benign result of the first round of the French elections has triggered a “risk on” relief rally in global financial markets.

As such, Gold opened the Asian session down $20.00 at $1265.00 and has steadily recovered as the reality of the election result settles into the market.

Technically, Gold is still in an uptrend with the 30-day moving average still below the market at $1256.00. We expect Gold to recover and re-test the April 17th high of $1295.00 in the near-term.

Over the last five trading days, shares of NCM have dropped close to $2.00.

The lower price of Gold combined with the closure of the Cadia mine has pushed the stock down into the buy zone of $23.20; still above the 30-day moving average at $23.00.

We expect both the price of Gold and shares of NCM to rebound and trade higher over the medium-term. Investors looking to profit from higher Gold prices can also look at the QAU BetaShares Gold ETF.

Resmed – Buy the Dip

RMD will report their 3QFY17 results on 27th April. Early success of the AirFit 20 series should help to underpin year-on-year underlying earnings growth 15%+ to $US$520m.

FY18 we expect revenue of US$2.3b, EBIT US$580m, (from US$520in FY17), EPS US$3.10 and DPS US$1.45, placing the stock on a forward yeild of 2.1%

We like RMD’s growth outlook and therefore we’re encouraged to buy RMD ahead of the result and to add to the position on price retracements.

To help enhance the yield, we’re selling out-of-money call options, allowing for reasonable capital growth whilst at the same time increasing the cash flow from the dividend and call option income to over 10% p/a.

Chart – RMD


Australian Bank Earnings

On 2nd May, ANZ will report their half-year earnings. The market is expecting a net profit of around $3.7b and DPS for the half year of $0.80.

4th May, NAB will report their half-year earnings.  Net profit should be around $3.4b and DPS of $1.00.

5th May, Macquarie Bank reports. Net profit is expected to be similar to last year at $2.15b and DPS of $2.52

8th May, WBC report their half-year result. Net profit should be $4b and DPS $0.95

On average, the market is looking for approximately 3% underlying EPS growth among the banks and dividends to remain steady, or the same as the previous 12 months.

Charts – MVB (Vaneck Aust Bank ETF)