Chart Update – Banks

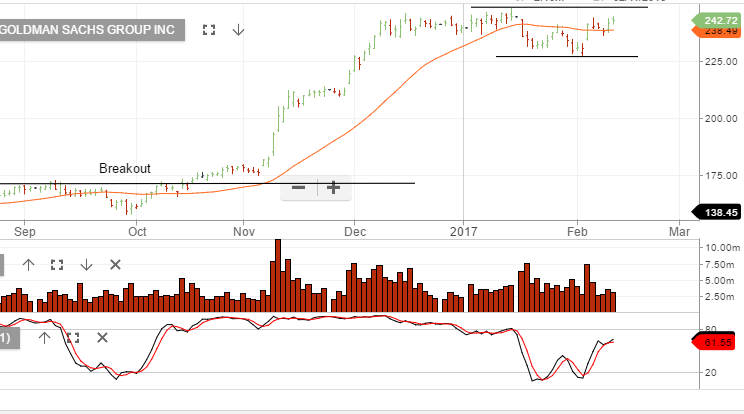
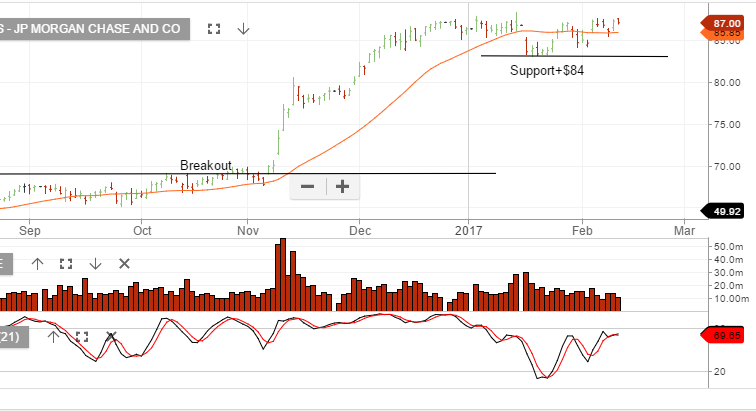
Goldman Sachs and JP Morgan remain within the consolidation range which began in early December.

In our local market we’ve seen BOQ & BEN sell off 10% from the January peak-to-trough. NAB reported weak revenue growth and higher than expected expenses, leading to a 1% fall in profit.

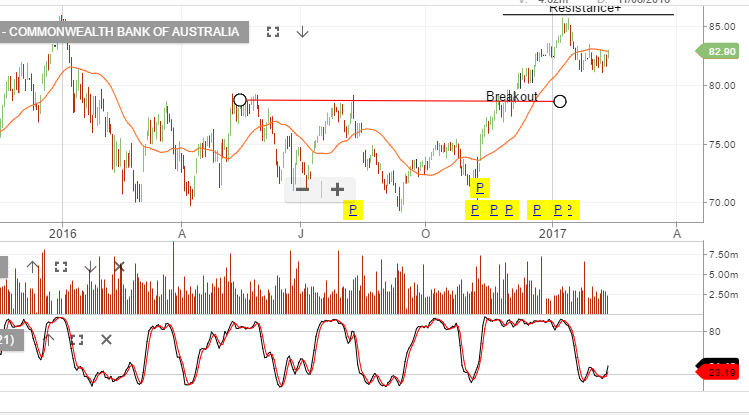
CBA report their half year results on Wednesday, we expect NPAT of $4.8b and DPS $2.00. 3 – 5% underlying EPS growth on the same time last year.

ANZ corrected 10% from peak-to-trough.

We’ll watch the US banks in the weeks ahead to see which way they break from their current consolidation range.

Chart – Goldman Sachs
Chart – JP Morgan
Chart – CBA


ETF WATCH: Australian Dollar Pointing Lower

The Australian Dollar is under pressure going into the weekend and in front of next Thursday’s key employment report.

This week’s RBA statement reflected a neutral stance regarding future interest rate policy, but the currency was mentioned as a potential headwind to Australia’s terms of trade should the AUD/USD continue to appreciate.

The tone of the RBA statement illustrates the bias the central bank has for a weaker AUD/USD as a means to help domestic exporters. In short, the RBA would much rather see the AUD/USD at .7000 than at .8000.

Technically, the AUD/USD has posted a lower high everyday this week after failing to break the .7700 level last Friday. The relative strength indicator (RSI) is rolling over and pointing lower at 60.50, which suggests range extension below .7500 in the near-term.

For investors who want to profit from a lower AUD/USD, the ASX offers two dynamic Exchange Traded Funds (ETFs): the BetaShare USD and the BetaShare YANK.

The USD is an unweighted, inverse unit trust which gains a percentage value tied to the AUD/USD. The YANK is also an inverse unit trust, but has a 2.5% weighting. This means that a 1% drop in the AUD/USD will see a 2.5% increase in the BetaShare YANK ETF.

Update on Recent Buy Recs

We’ve been buying the following names in the past week and selling covered call options.

WFD, GPT and SCG within the REIT space.

TCL and SYD defensive infrastructure.

RMD, CSL & SHL as our preferred healthcare exposure.

AMC, BXB and ANN as industrial trades.

IAG & MPL as insurance exposure.

The names above are performing well and in many cases have been the leading ASX companies by % gain, over the past week. Tabcorp on the other hand has been a disappointing inclusion in client portfolios. Our exposure to TAH is only minor, as we don’t view it as a core holding. (rather a tactical trade based around the Tatts deal).

TAH remains within our buy range, although testing the lower band. We continue to feel there’s opportunity ahead. We are again buying TAH at these levels and will look to exit mid year. The upcoming ACCC decision on the Tatts deal, will likely be a positive catalyst and we expect TAH to trade back above $4.60.

The other names mentioned above, have been complimented with a covered call option, which is helping to deliver 10 – 12% cash flow from the option premium and the upcoming dividends.

Chart – TAH


.


AMP – Earnings Outlook

AMP FY16 normalised profit $486m. AMP announced a $500m on market buyback. 

FY18 reported profit is likely to remain flat on FY17 numbers and AMP’s ability to deliver against cost out in FY17 and continued cost discipline in future periods is the key to sustaining group EPS growth.

FY18 profit is likely to remain in the range of $900m – $930m, EPS $0.35 and DPS of $0.29 placing the stock on a forward yield 5.7%.

We remain cautions on AMP until the technical picture becomes more supportive.  Support may begin building above $5.00.

Chart- AMP


AGL Shares Spike Higher

AGL reported a 3.7% rise in underlying profits of $389 million to December 31st. This figure was inline with analysts’ forecasts.

However, shares of the energy retailer jumped to an all-time high of $24.05 at today’s open as company officials gave positive guidance into 2017 as retail power prices are expected to climb higher.

AGL said its full year underlying profit would reach the upper half of its forecast range of $720 to $800 million, up from $700 million last year.

The company also raised its half year dividend to 41 cents per share from 32 cents per share last year.

Chart – AGL

Suncorp

Suncorp shares have traded over .5% higher to $13.20 today after announcing a 1.3% increase in its half year profit results.

The company reported a net profit after tax of $537 million for the six months up to December 31, which is up from $530 million a year ago.

This represents top-line growth of 4.3% and, based on forward guidance, will raise its fully-franked interim divided by 10% to 33 cents per share.

This 33 cent dividend represents a payout ratio of 72% of cash earnings.

Chart - SUN

RIO delivers a solid 2016 result

RIO has delivered a solid CY16 earnings result of US$5.1b. A highlight of the result was the increased shareholder returns, with RIO announcing a final dividend of US$1.25ps

Revenue of US$35b, EBIT of US$7.8b and DPS of US$1.70 placing the stock on 3.3% yield.

Looking out over 2017, we expect a relatively flat market for iron-ore prices which will translate into only moderate EPS gains for RIO (5-10%).  We assume revenue of US$38b and EBIT at US$9.5b, EPS $3.20, DPS US$2.50, which will place the stock on a forward yield of 4%.

Share buy backs and capital returns will help underpin the story here with RIO.

We see both RIO and BHP fully valued at current prices. With short term volatility likely ahead for Iron-ore prices, we recommend taking profits or selling covered calls to enhance the yield.

Chart – RIO


CAR Reported 1H EPS

CAR Reported 1H EPSg of 5%, is the current 22x P/E sustainable?

Assuming an acceleration from 5% EPS growth to 10% EPS (big ask) in the next 12 months it will place CAR on a 3.5% yield. We’ve seen other high PE stocks negatively rerate such as TPG and I think some caution and close watching of the earnings trend in CAR is required.

Global tech players such as eBay, gumtree, facebook etc are becoming more active in CAR’s business space. This may be part of the reason EPS growth is dropping off.

Chart – CAR