XJO – Index Update

The XJO is holding support at 5600 points and maintaining a bullish short-term price structure.

We’re cautious due to stretched equity valuations, political risks in the Euro zone, debt stability in China and low revenue growth in many industry sectors.

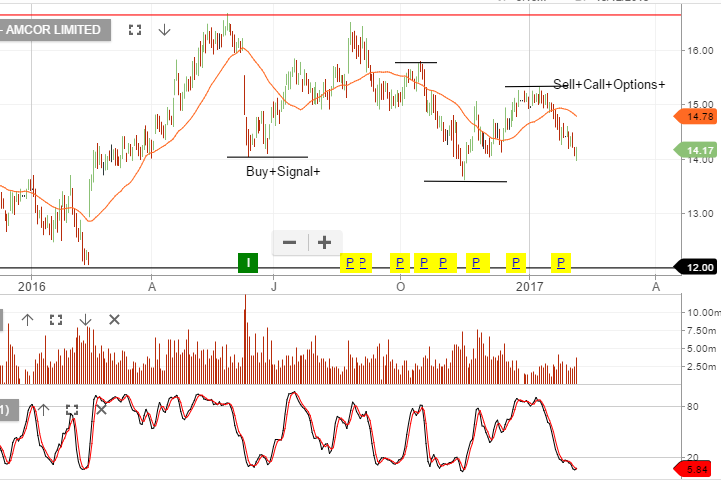
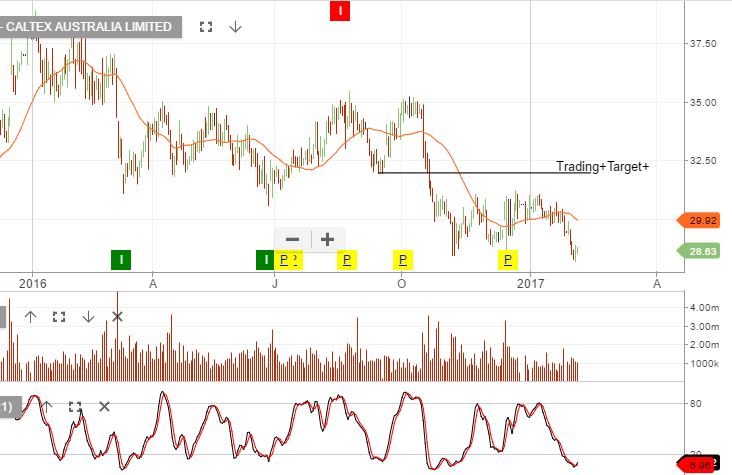
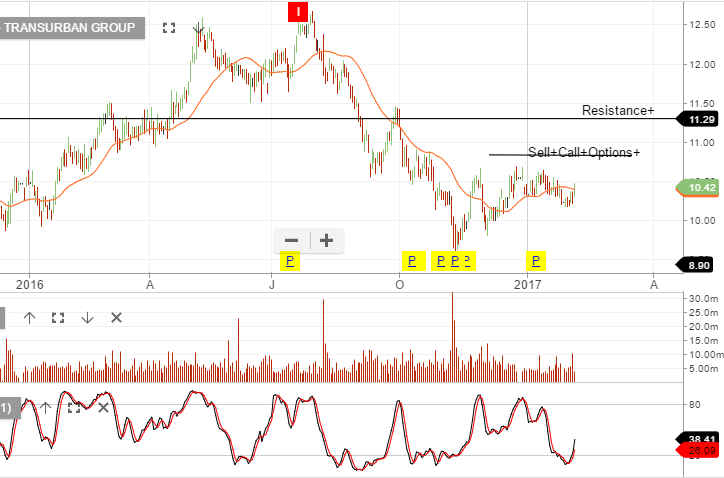
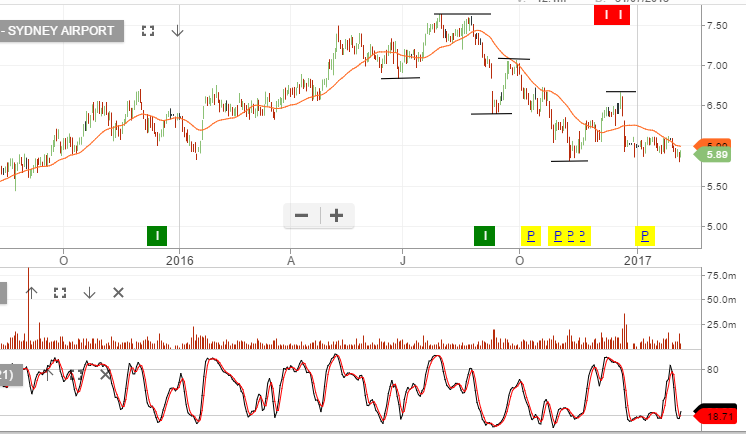
To mange these concerns we’ve tilted portfolios to defensive assets and become aggressive with our covered call overlay. The bulk of our portfolio returns will come through dividends and option premium over the next short while.

Furthermore, we’re just not convinced the reflation trade the market has positioned around, will actually materielize in FY17.

Chart – XJO

ETF Watch – Crude Oil Falls On Increased Storage Data

West Texas Crude Oil prices dropped over 2.5% overnight as weekly stockpiles rose much greater than expected.

The American Petroleum Institute (API) reported crude oil in storage rose by 14.2 million barrels. That surge in storage was more than 5 times analysts’ forecast and the second largest increase in the history of the data series.

The front month futures contract traded as low 51.30, which is over 5.5% lower than last week’s high close of $54.40.

Some market commentators are pointing to increased US shale production and decreasing global demand as a headwind for crude prices going forward.  The next key price support  will be found at the psychologically important $50.00 level.

Chart – OOO ETF

MQG re-affirmed full year guidance

Macquarie re-affirmed FY17 earnings will meet market expectations. This places FY17 revenue at $10.3b and cash earnings flat on FY16 at $2.1b.

FY17 EPS will be $6.10 and DPS $4.30, placing the stock on a forward yield of 5.3%.

We see Macquarie tracking sideways at best and downside risks increasing from a pickup in macro volatility.

Chart – MQG


Gold Catches Safe-Haven Bid

Spot Gold prices hit a 3-month high of USD 1,235.00 as geopolitical tensions increased the yellow metal’s safe haven appeal.

Political uncertainty regarding upcoming elections in Europe, the US and Iran exchanging threats and unstable banking sectors in Italy and Greece have all added to investors’ interest in Gold.

From a technical perspective, the next key price target is at the November 11th high of USD 1292.00. We would suggest exiting long positions in that area.

Shares of Newcrest Mining have followed the gold price higher and have rallied over $3.50 during the last eight trading sessions. We expect to see the $24.50 level offer the next area of resistance and look to exit long positions in that range.

Chart – NCM


Transurban Lifts H1 profit

Shares of Transurban are up over 3.5% in early trade as the toll road developer increased H1 net profit 41.9% to $88 million on the back of strong traffic flows and operational performance.

The company also lifted revenue by 26.3% to $1.3 billion in the six months to December 31st.

As a result, Transurban will pay a partially franked interim dividend of 25 cents per share, up from 22.5 cents from the year ago period.

At $10.75 per share, we consider TCL a defensive income play. With limited scope on the upside, we suggest selling covered calls in the $11.25 area  for an annual return in the 10 to 12 % range.

Chart – TCL

IAG – Bounces Off Support

We highlighted in this month’s video report that IAG would likely find support at $5.50. The stock has since traded down and tested the $5.50 range and buyers have pushed the stock back to $5.80.

We see a place for IAG in portfolios based on FY17 earnings of $900m, EPS $0.36 and DPS of $0.32 which places the stock on a forward yield of 5.5%. We compliment this with a tight covered call option to increase the cash flow to 12% on an annualised basis.

$6.00 remains resistance and we don’t see the stock trading above this level in the short term.

Note: IAG has implemented an optimisation program that will reduce gross operating costs by an annual run rate of at least 10%, or $250m by the end of FY19.

Chart – IAG


Banks – BEN 1H17 Earnings Update

BEN will report 1H17 earnings on Monday the 13th.  We’re expecting 1 – 4% growth on the same time last year.  Full FY17 forecast profit should be around $450m.

In general, across the bank names we expect margins and credit quality to be the key areas of focus at the upcoming results. Benign credit growth conditions underpinned by slowing housing credit & flat growth in business lending.

Highly leveraged household balance sheets and ongoing pressure from the regulator to improve the quality of housing lending, should restrict the growth outlook into FY18.

Chart – BEN
Chart – MVB

NAB – Q1 Profit

The National Australia bank (NAB) announced that Q1 profits have dropped 1% to $1.6 billion and rising staff wages and increased redundancy costs diluted the bank’s earnings.

In an update this morning, NAB reported revenue increased by 1%, but expenses, including a 5% pay rise for staff, grew faster. The bank said the rise in staffing costs was mainly due to a new enterprise agreement that came into effect in October and redundancy payments to staff who left the bank.

US banks rallied on Friday night which is helping to support our local bank names today. We give the bounce the benefit of the doubt but a break below recent support levels will likely see another 5 – 7% correction to the downside.


Chart – NAB


PBoC Surprising Rate Hike

The People’s Bank of China (PBoC) surprised the market by tightening monetary policy on Friday for the first time in almost 6 years.

On the first day back from the Lunar New Year Holiday, the PBoC increased the cost of borrowing across their short-term curve from 1-month to 2-years. This move also raised the overnight deposit rate from 2.75% to 3.10%.

A rate hike on the first working day after a holiday signals the start of a different policy direction away from Central bank stimulus and towards more fiscal and domestic demand policy measures.

With Chinese factory orders rebounding after several years of deflation, Friday’s move reflects  the PBoC’s determination to rein in leverage which has seen rapid expansion in the bond and property markets.

As a result of the higher rates, the Chinese Yuan traded to a 4-month high of of 6.79  against the US Dollar into the weekend.

AMC, CTX, SYD, TCL & TLS

We’re allocating funds to defensive names with moderate earnings growth. By adding tight covered call options we’re boosting the cash flow and generating our return on investment (ROI) through a lower risk, lower volatility investment process.

We’re holding small levels of hedging through inverse ETF’s and are mindful of the increasing number of stocks within the ASX 100 and the US S&P100 that are showing fading momentum. High valuations in many names combined with relatively low revenue and profit growth is likely to weigh on share price performance.

The following names we’re currently buying. AMC, CTX, SYD, TCL & TLS

Chart – Amcor
Chart – CTX
Chart – TCL
Chart – SYD
Chart – TLS