European Central Bank (ECB)

US stocks rose to fresh highs overnight, extending gains as the European Central Bank (ECB) said it would extend the duration of its stimulus program but reduce the monthly volume.

Both US and European stocks initially sold off as investors concluded the bank was tapering its program of quantitative easing , but reversed quickly during Mario Draghi’s press conference. The ECB chief made clear that the extension of the program by 12 months would add more stimulus even though the monthly purchase rate would drop from €80 billion per month to €60 billion per month. This pencils out to €560 billion in fresh stimulus compared to the market’s expectations €480 billion.

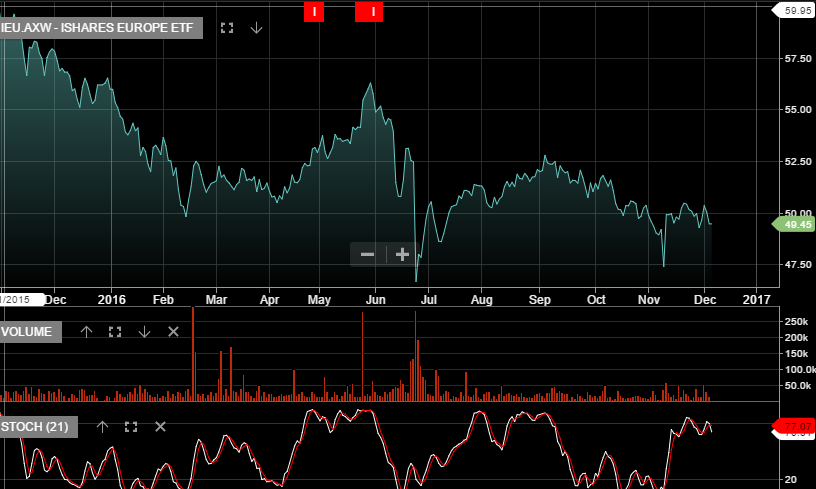
The Stoxx Europe 600 index gained 1.2% to close at its highest level since January.

Looking forward, we see the ECB decision as generally positive for the ongoing bullish theme for G-7 stock markets.

Chart - EUR/USD
Chart – EUR/USD

European Central Bank (ECB) Meeting

US and European equities pushed higher as investors showed confidence ahead of today’s key European Central Bank (ECB) meeting in Frankfurt, Germany. All the major indices including the FTSE, DAX, CAC, DOW and SP 500 posted gains in excess of 1.5% on the day.

The ECB is widely expected to announce an extension of its massive Quantitative Easing (QE) stimulus program and may even increase, or expand, the scope of the asset pool to include European corporate bonds and equities.

The ECB has been the most aggressive central bank in providing monetary stimulus this year. Since March, it has been buying €80 billion of assets per month, mainly in the form of Government debt. Although the program is scheduled to expire in March 2017, analysts are expecting at least a six-month extension to be announced today.

As a note of caution, it’s important that ECB chief Mario Draghi rejects any talk about an early tapering of the monthly asset purchases. Just the rumor of a “scaling back” of stimulus before the September ECB meeting sparked a sharp sell-off in G-7 equities and credit markets.

However, with the US FOMC meeting scheduled for next week, our base case is that the ECB statement will not mention tapering and, instead, focus on the technical adjustments to the QE program. On balance we expect this scenario to have a neutral to bullish impact on G-7 equity markets.      

Chart - Dow Jones
Chart – Dow Jones


Origin Energy – Reducing Debt

In an effort to streamline its business and reduce debt, Australia’s largest gas and power retailer Origin Energy has announced plans to divest its conventional oil and gas exploration assets through an IPO on the ASX in 2017.

Origin will group these assets into a new listed company called NewCo. These combined assets have an estimated value in the $2.5 to 2.8 billion range, based on a forecast of $50/$70 crude oil prices. At that valuation, proceeds of between $1.8 to $2.0 billion are expected to be allocated back to Origin.

Considering the uncertain outlook for global oil prices going into 2017, Origin’s strategy appears to be reasonable but isn’t a game changer in terms of its share price valuation.

With the current share price trading around the high of the year at $6.58, we consider this news to be neutral to bullish. However, with crude oil prices unlikely to trade above $60.00 in the near-term, the $7.00 level could cap gains over the medium-term.

Chart - ORG
Chart – ORG

ETF Watch – iShares Europe (Italian Election Outcome)

Without a sitting government, it’s difficult to see how there can be any official help for Italy’s beleaguered banking sector. In short, now that the “No” vote has prevailed, Italy’s banking system is for all intents and purposes insolvent.

In addition, the size of Italy’s government debt is also a concern. Depending on which figures you look at, the total outstanding Italian debt is more than €2 trillion, which will have to be serviced even if the Italian voters someday choose to leave the European Union.

On balance we feel that the brunt of the market fallout will be felt across the European Union. However, after the sharp rally in global stocks during the month of November, this referendum news could very well trigger some re-balancing of of financial positions going into the upcoming ECB and the FOMC meetings.

Chart - iShares Europe
Chart – iShares Europe

RBA Meeting – Rate Decision

The RBA will hold it final meeting of 2016 today with their announcement scheduled for 2:30 pm Sydney time. All 26 economists polled by Bloomberg have the cash rate remaining unchanged at 1.5%, while the financial markets reflect only a 2% chance for a 25 basis point cut.

Given these expectations, any market moving news will come from the wording of the of the accompanying monetary policy statement which could provide clues as to the policy bias of the RBA board.

In particular, financial markets will be focusing on the language used towards the housing and labour markets, as well as the board’s outlook on inflation.

Of these three areas, housing and labour have shown mixed results since the last RBA meeting: there has been a noticeable acceleration of housing loans, but a sharp fall in building approvals. Similarly, New Job ads have increased, but employment growth is heading in the opposite direction.

The recent wage price index report, which recorded its slowest increase on record for Q3, will likely keep inflation expectations in the lower end of the RBA’s target band.

On balance, we expect the RBA to remain unchanged with a slight shift to a more “Dovish” bias going into next year. This stance should be supportive for stocks, in general, and slightly negative for the Australian dollar.

Chart - AUD
Chart – AUD
Chart  - RBA Rates
Chart – RBA Rates

Dow Jones 30 Review – Video Update

In the following recording we provide a review of the top 30 stocks that make-up the Dow Jones 30 Index.

This is a great way to familiarise yourself with the largest US companies by market capitalisation.

If you’re a subscriber to our professional algo trading service you’ll now be able to tie-in the daily US signals with some of the charting and analysis covered in the following recording

Algo Engine – Suncorp

We note the algo short signal that occurred Friday on Suncorp. The stock is making a lower low and lower high pattern and resistance is at or near $13.00.

Given the backdrop of equities looking extended, in particular the financials, we’re willing to look at SUN on the short side with stops above $13.00. Downside price target will not extend past $12.25 as the 6% yield remains well supported. This is a trade that will be driven by index selling rather than company specific weakness.

For our portfolio clients holding SUN, we use this as an opportunity to enhance the yield and sell $13 calls into June 17 for a $0.50 credit, whilst keeping exposure to the $0.30 February dividend. This enhances the annualised cash flow to over 10%.

Chart - Suncorp
Chart – Suncorp


Australian Banks – Credit Growth

Australian consumers borrowed less in the month of October with RBA data showing private credit growth at 0.5% (5.3% year on year) versus a YoY rate of 5.4% last month. A closer look at the data suggests Australians are interested in buying real estate and not much else. Even though housing credit growth was flat last month at 6.4%, the pace is still well above the 4.4% growth in Business credit and the rate of Personal credit; which actually dropped to -1.1% Year on year.  It’s likely that the growth in housing credit has been supported by the RBA’s rate cuts in May and August. However, the RBA won’t miss the fact that lending over the last 12 months has a flat to lower trajectory, which may influence their policy directives going forward.

Australian banks continue to push up against the top end of the their price channels. We’re mindful of the rally in US banks helping to boost investor sentiment towards the sector, yet there is limited evidence domestically  of any pickup in earnings on the horizon.

Chart - CBA
Chart – CBA