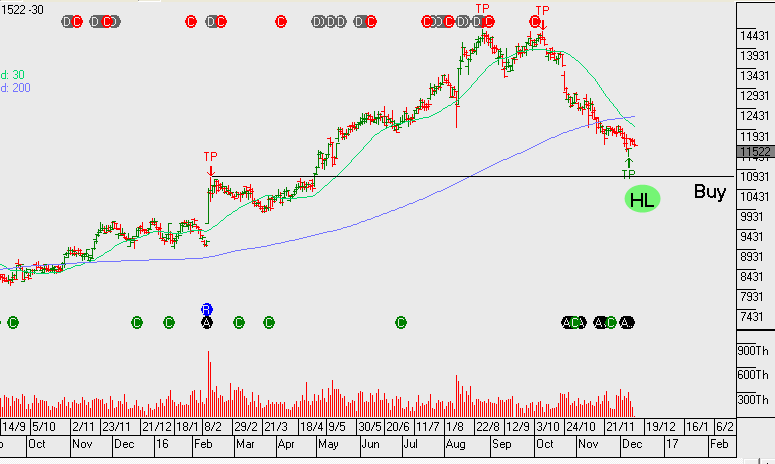
QANTAS – Algo Signal
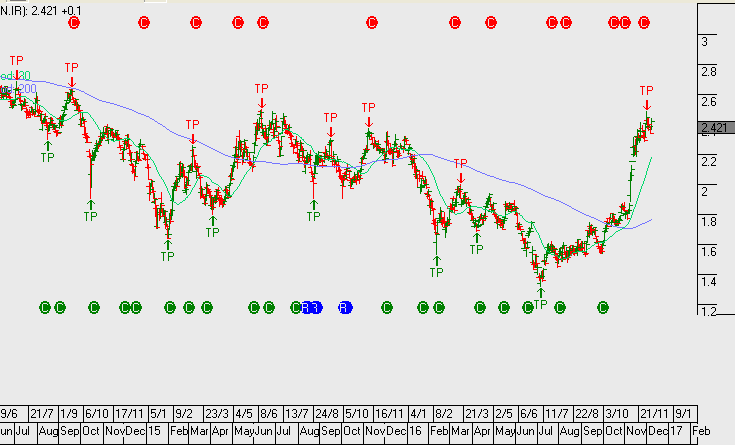
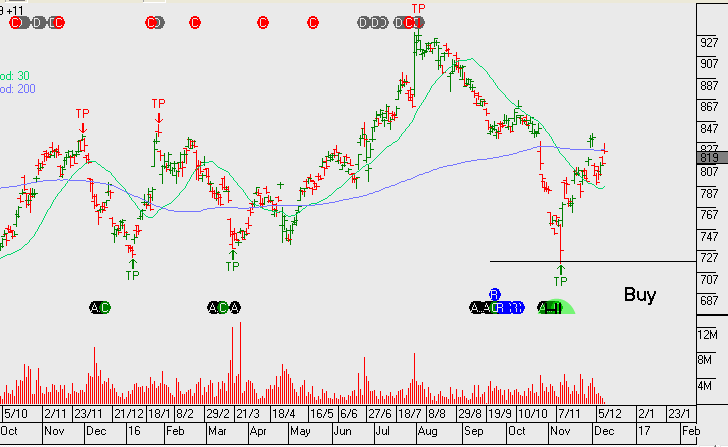
We’re watching Qantas on the short side. Resistance at $3.60 is likely to cap any rally and momentum will remain weak whilst oil prices trade higher following the OPEC cuts.
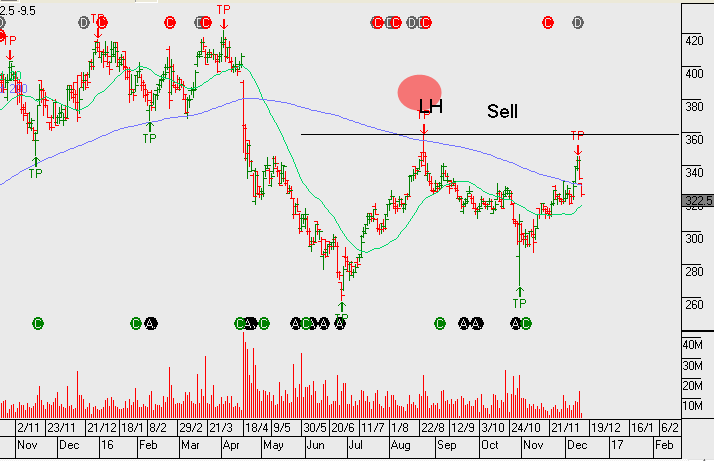
We’re watching Qantas on the short side. Resistance at $3.60 is likely to cap any rally and momentum will remain weak whilst oil prices trade higher following the OPEC cuts.
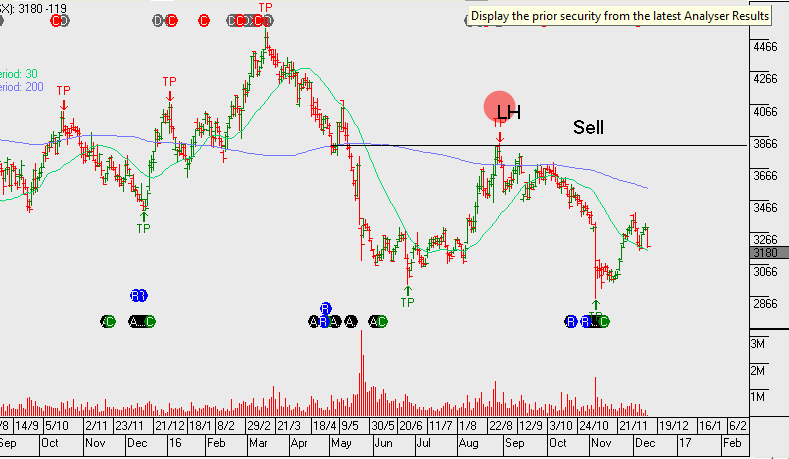
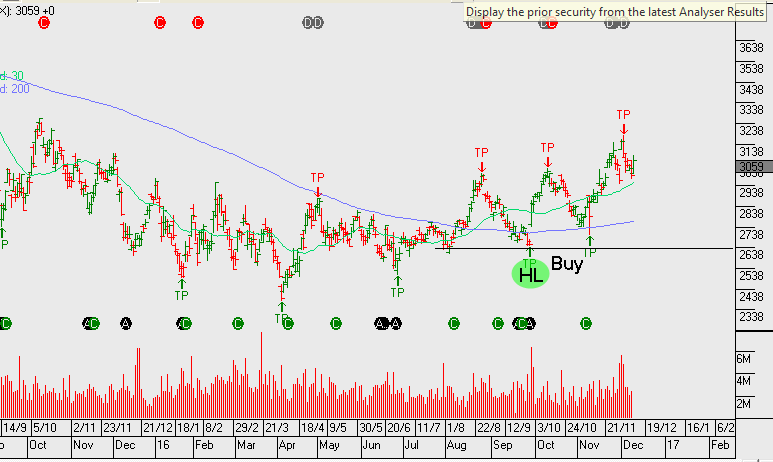
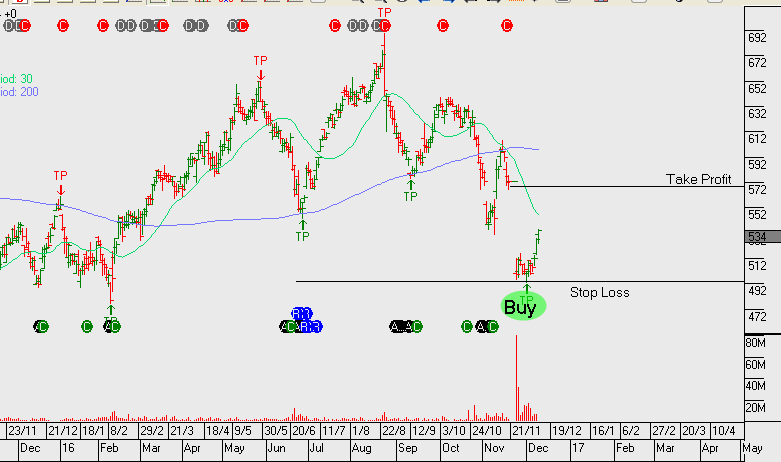
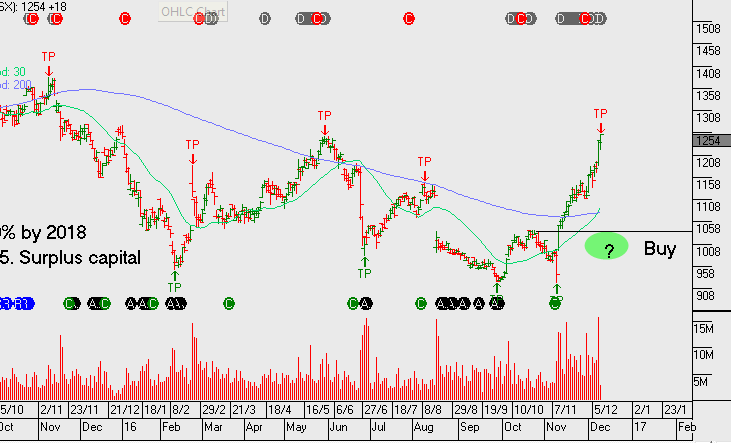
We’ve been on the short side of Flight Centre for most of 2016.
The share price rebounded from their early November low of $29.50 to close last week at just under $33.00. However, structural headwinds, recent earnings shortfalls, and overly optimistic guidance suggest clear skies are not ahead for the firm.
On November 4th, Flight Centre indicated that 1H 2017 profits before tax (PBT) would decline 18 to 28%. The company maintained an FY17 earnings guidance of $320m – $350m. We believe this is overly optimistic and unlikely to be achieved given international flight price deflation.
Gradual ongoing selling pressure in FLT could see a low around $28 in early to mid 2017.
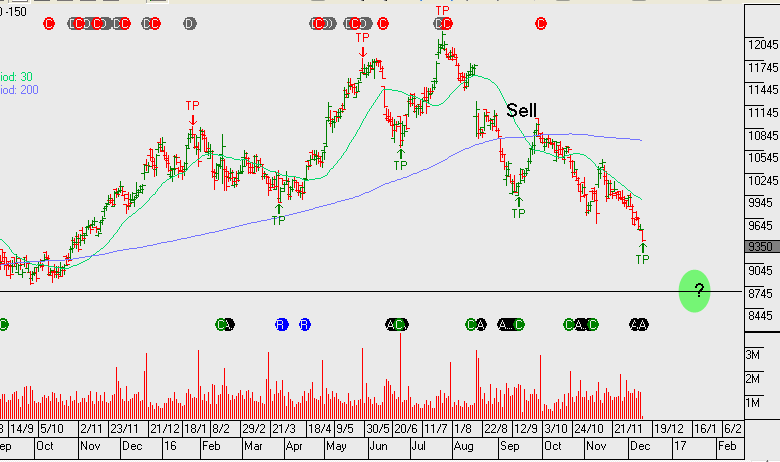
Healthcare names are being sold off due to their high PE ratios and negative sentiment towards the sector, which is permeating from the US healthcare stocks leading the sell off.
Keep these on your watch list as the selling will likely exhaust and we’ll look for entry levels triggered by the algo engine.
We suggested going long oil names ahead of the OPEC meting, our preferred buy ideas were WPL, ORG, OSH and BHP. We see further upside ahead!
On November 30th, leaders of the Organization of Petroleum Exporting Nations (OPEC) agreed to their first production cut in eight years by collectively deciding to curtail crude oil production by 1.2 million barrels per day. Since then, West Texas Intermediate (WTI) Oil futures have gained over 6% from $45.20 to $51.50 at Friday’s NYMEX close.
The OPEC agreement got a shot in the arm on Saturday as 11 Non-OPEC oil producing countries agreed to cut their output by 558,000 barrels per day. This is the first time in over 15 years that a global agreement to cut production has been struck and adds fundamental support to the current rally in Crude Oil.
Technical indicators suggest the January WTI contract can move higher this week. The recent high in the $52.70 area is the next logical target, but there’s scope for a move back above $54.00 after this weekend’s Non-OPEC agreement. Near-term support is seen in the $49.60 area.
Although investors may be rightfully sceptical about the longevity of the OPEC and Non-OPEC productions cuts, our reading of the charts suggests being patient in trying to pick a near-term top in crude oil prices.
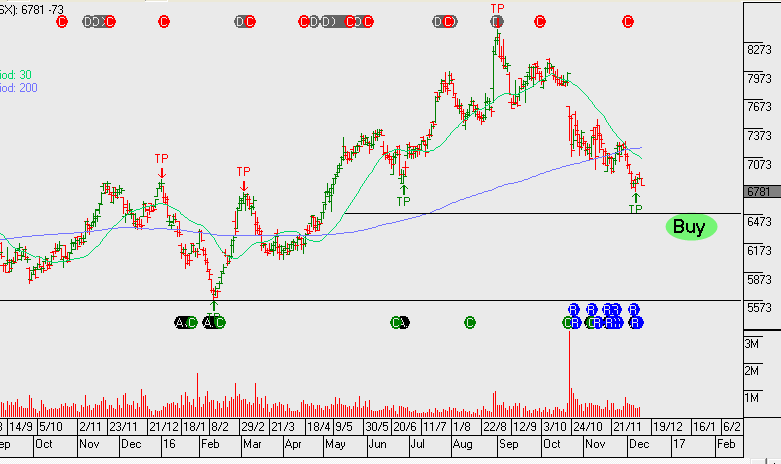
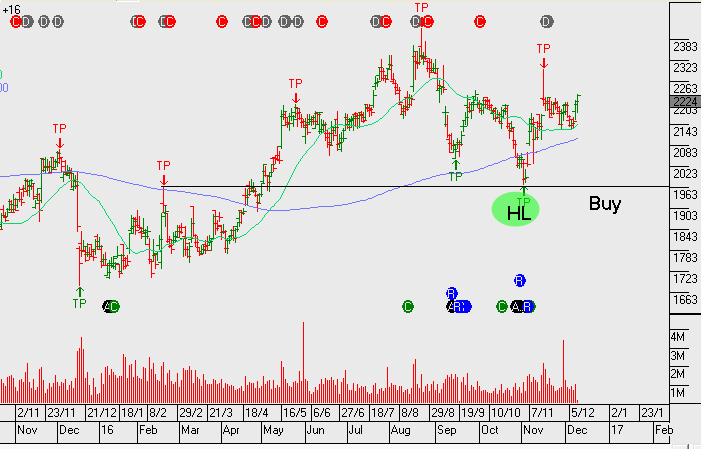
We issued a buy rec at $5.00 on Boral following their recent announcement to acquire Headwater in the US.
Boral will raise $1.6bn via a fully underwritten pro-rata accelerated renounceable entitlement offer, $450m via a fully underwritten placement and the remainder through cash and debt. The placement is part of an overall $2bn+ equity raising to fund the $3.5b acquisition of Headwaters
FY17 PE is 13.5x and assuming EBITDA of $670m we have the stock on a forward yield of 4%.
To help mange the risk we use call options to achieve our target exit price.
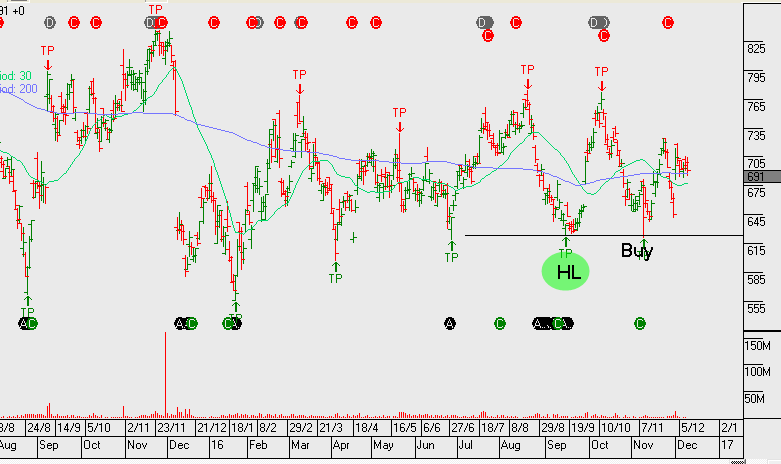
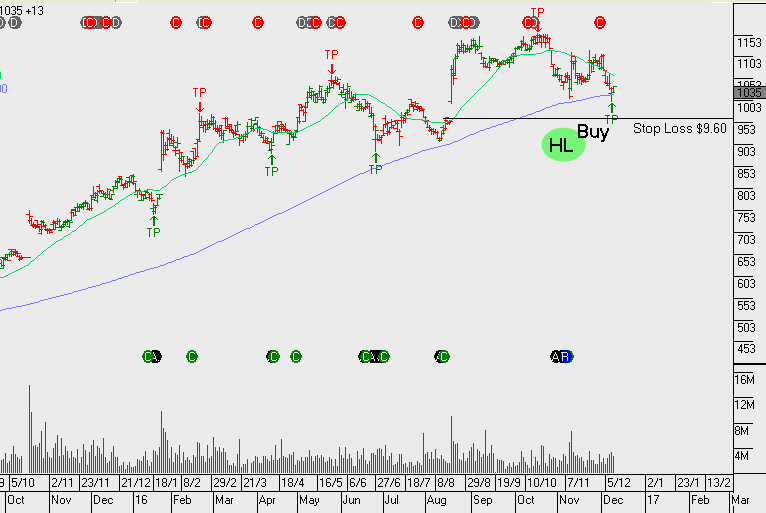
The algo engine triggered a buy signal on TWE and we note the price action on the chart is looking supportive.
FY17 EPS growth of 20% generates a price target of $11.50
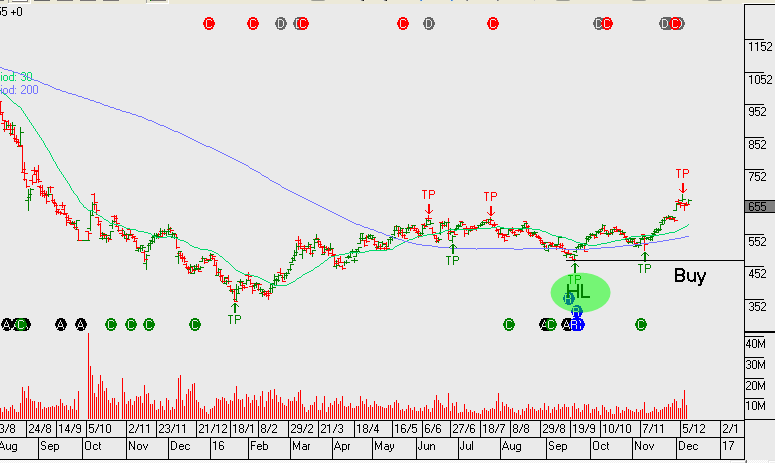
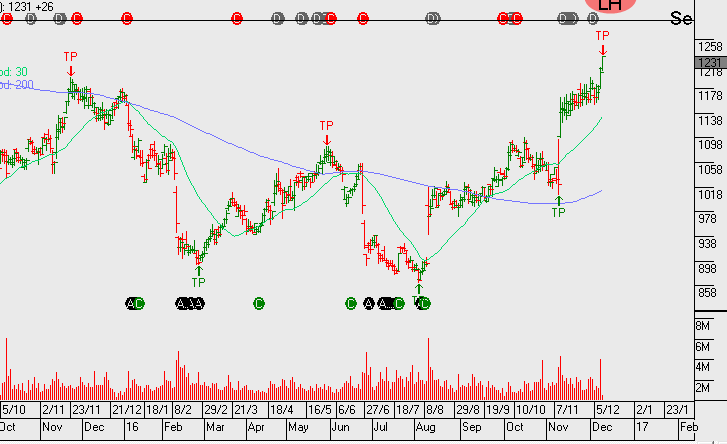
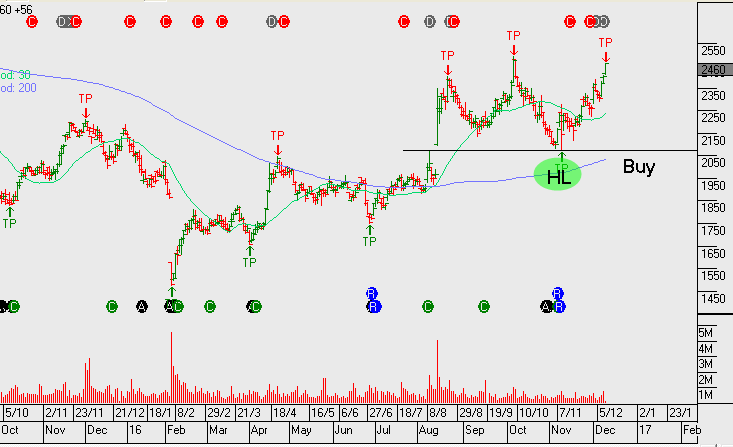
Since posting a low of $9.40 on November 9th, shares of QBE have rallied over 30% to close at $12.58 on Friday.
As a result of a major restructuring and consolidation undertaken in 2013-15, the group is better positioned to benefit from higher earnings on their USD 25.7 billion high-quality investment portfolio. QBE’s stock price is highly correlated to the yield on US 10-year Treasuries, which have jumped by 60 basis points since early November.
In addition to boosting returns on security holdings, higher interest rates help QBE by lifting the discount rate used to value future claim liabilities, thereby reducing the value of these liabilities. It’s estimated that a 50 basis rate rise could add an extra USD 70 million to QBE’s net profit.
2016 earnings forecast $760 million, 2017 jumps over 20% to $920m, this places QBE on a 5.8% forward yield. Total dividends for 2017 are likely to be around $0.60 per share (50% franked).
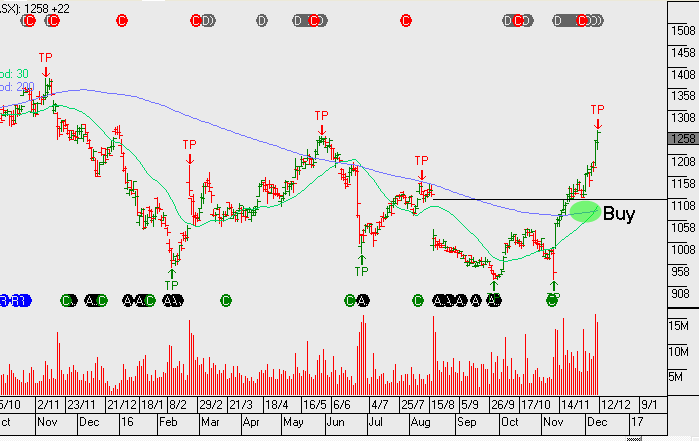
Chart – QBE
The algo engine has triggered a number of ASX signals in the last 48 hours. CSL has sold-off and is worth watching, the other theme is the potential short in the insurance names IAG & SUN.
We’ll be looking at these trades next week.
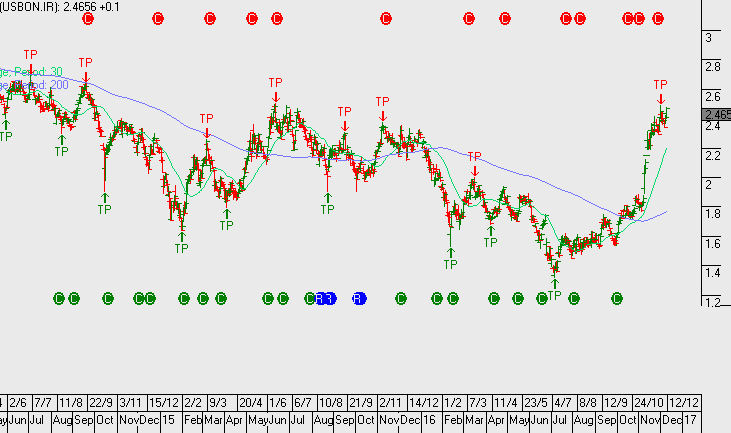
Computershare and QBE Insurance are experiencing strong rallies at present, the catalyst being higher interest rates in the US. The FOMC meeting on the 14th of December may provide a short term cap in the bond yield rally, if this occurs QBE and CPU will likely run into resistance.
The below names are performing well, following the recent buy signals from our algo engine.
Level 17 Chifley Tower
2 Chifley Square
Sydney, NSW 2000
1300 614 002
Investor Signals Pty Ltd
ABN 44 143 555 453