US Stock Update: Grinding Higher Into Earnings Season

US equity markets lifted for another record high across the board on declining volume.

Even the broad-based Russell 2000 Index hit a fresh record of 1,512 on its eighth consecutive trading day of gains. This is the longest streak since just after the US election in November.

It’s difficult to imagine this pace will continue and equity valuations at these extreme levels remain exposed to various unfavorable surprises.

One of these surprises could come within two weeks as US earnings season begins.

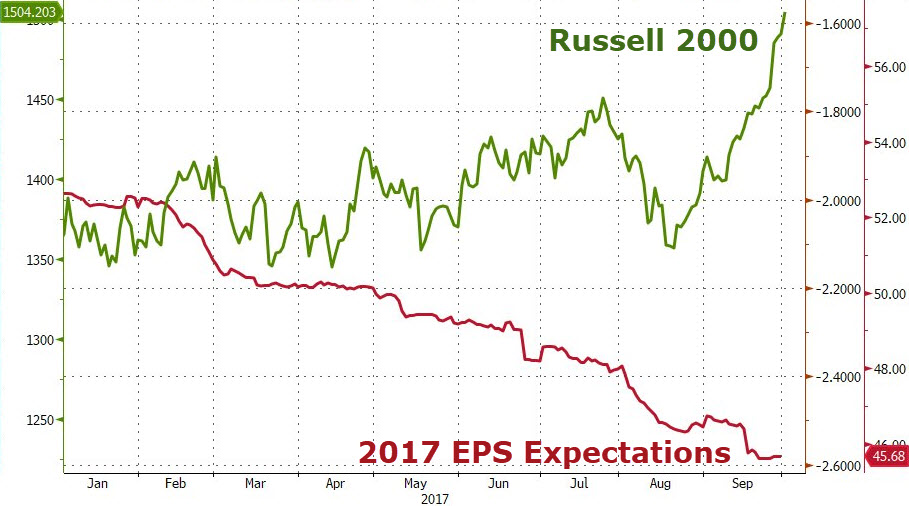
As illustrated in the chart below, there is a clear and widening divergence between the Russell Index and the expected earnings per share.

Russell 2000 Index


Trump’s Tax Plan: A Boom Or A Bust?

It’s almost been a year since Donald Trump was elected to the White House.
One of the key promises Mr Trump made to voters during his campaign was for the “largest tax cut” since the early 1980’s.
Not including the vague leaks over the last three months, a tangible, nine-page brief of the tax reform plan was just released last Wednesday.
Just a few of the key features of the tax plan include: lowering the corporate tax rate from 35% to 20%, dropping the number of personal tax brackets from 5 to 3 and a one-time repatriation tax, designed to bring corporate profits back from overseas.
From a market perspective, it’s the repatriation tax that has the financial media the most excited.
It’s been estimated that US multi-national corporations have somewhere between $3.5 to $5 trillion domiciled offshore. The prospect of having these funds sent back to the USA, with a maximum tax rate 10%, is very bullish for both the USD and US stocks.
At this point, the biggest question for investors is: will this tax reform plan become law and have a positive impact on US equities and the USD, or will the proposal become another victim of the political gridlock which has permeated Washington DC since Mr Trump took office?
Over the last few days that the tax proposal has been out in the public, politicians from both sides of the aisle have criticized various provisions and changes to the tax code.
As expected, core Democrats are calling the plan a tax cut for the rich at the expense of the middle class, and the small group of Republican “deficit hawks” have refused to support the changes until they are scored by the Congressional Budget Office (CBO).
In this context, “scoring” means calculating how the proposed changes to the tax code will impact the federal deficit, relative to the spending and entitlement costs allocated in the Federal budget.
In our view, it’s this last point which is the biggest hurdle to any meaningful tax reform this year. The simple problem is that the CBO can’t score the tax plan against the 2018 Federal budget……….because there is no 2018 budget.
In fact, there has not been a legislated budget passed in the US since 2009, with the Federal government currently operating under another Continuing Resolution which will expire in December.
This means that before any tax reform plan can move to the Congress for a vote, a budget for 2018 must be passed.
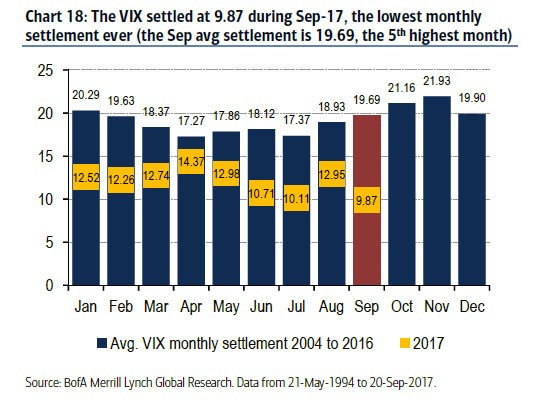
The chart below illustrates the monthly closing price of the VIX volatility Index in 2017, relative to the average prices dating back to 2004. It’s clear that the monthly volatility has been below trend in every month this year, with September closing almost 10 big figures lower than the average.
With equity valuations at extreme levels versus forward earnings per share, we expect some market event to trigger an increase in volatility back to the historic averages. However, at this point, we don’t expect that event to be the recently released tax reform proposal.


Monthly VIX Index


FOMC Overview

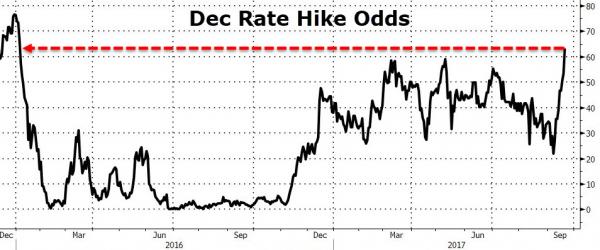
As expected, the US FOMC voted to keep rates unchanged last night but signalled that it still expects one more rate hike before the end of the year.

If that’s the case, then the FED Funds target will have been lifted from .25% to 1.50% in just over 12 months. The “Dot plots” were revised slightly lower from 3.0% to 2.75% by the end of 2019.

The response from US stock indexes was muted, but we expect the combination of higher borrowing costs and the reduction of the FED balance sheet to temper any significant gains in US equities into the end of the year.


FOMC Preview: It’s All About The Balance Sheet

This coming Tuesday and Wednesday, the FOMC will meet to discuss the next move in US monetary policy.

Over the last several months, it’s been well-telegraphed that this meeting will focus on unwinding QE and shrinking their balance sheet. The amounts and the mechanics have already been announced. Now it’s just a matter of announcing a starting date.

US financial markets have been brushing off the Fed and have done the opposite of what the Fed has set out to accomplish.

The Fed wants to tighten US financial conditions. It’s worried about asset prices and that these inflated assets, which are used as collateral by the banks, pose a danger to financial stability.

The FED has mentioned several inflated asset classes by name, including equity prices and commercial real estate, which backs $4 trillion in loans heavily concentrated at regional banks.

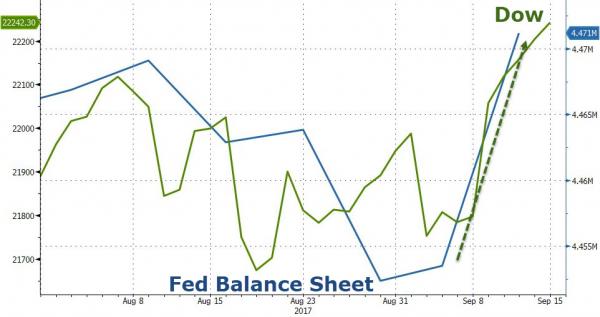
The FED has raised rates four times since December 2015, including three times over the past nine months. As the chart below illustrates, the relationship between the DOW Jones Index and the FED’s balance sheet is highly correlated.

As such, the FED’s decision could be a prime driver of US equities next week.

US Debt Crisis Averted………Until December

US Stock indexes may have dodged a bullet today when President Trump defied his White House advisors and sided with Democrats to defer the debt ceiling debate until December.

Using the legal structure of a “continued resolution” linked to emergency aid to victims of hurricane Harvey, the proposal would suspend the borrowing cap, currently at $19.9 trillion, until December 15th.

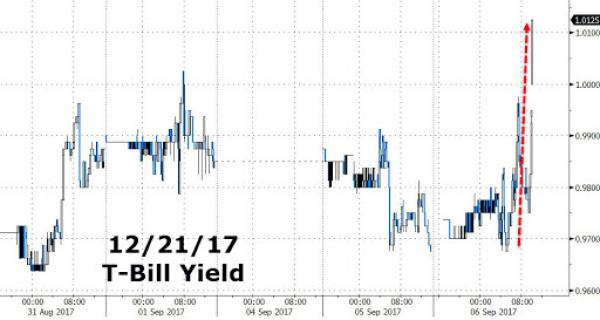
And while this manoeuvre calmed the nerves of T-Bill investors into the October maturity, the fear premium of a government shutdown has just been transferred to the December maturity.

Over the next few days we expect to hear more about how this political tactic will impact the administration’s legislative goals on tax reform, infrastructure programs and border security.

The prime risk to US equity markets is that credit agencies view this failure to address the debt ceiling as cause to downgrade US Sovereign debt ratings.

In short, “kicking the can” down the road has not made US assets less risky at current levels.

December T-Bill Yields


US Jobs Outlook Weakens, Debt Ceiling Concerns Continue To Grow

There were no bright spots in yesterday’s US Payroll report.

The 156,000 growth in jobs disappointed and is well below the recent averages. The back two months were revised lower by a total of 41,000 jobs.

The unemployment rate ticked up to 4.4% even though the participation rate was unchanged at 62.9%. Weekly average earnings fell from .2% to .1%.

This was enough to lift US Stock Indexes higher into the weekend.

The NASDAQ had it’s best week since December 2016, finishing 2.75% higher, and the S&P 500 rose 1.5% for its best weekly performance in 4 months.

However, as illustrated in the chart below, the shortest end of the Treasury curve remains troubled as the debt ceiling panic continues to build.

And while the US 10-yr yields rose modestly to 2.16% after the payroll data, the T-Bill yield dislocation has extended out to 32 .25 basis points.

This  indicates that the market remains extremely nervous about a debt ceiling crisis over the next month, which is not bullish for US equities. 

September 21st versus October 5th T-Bill yield spread


Record Levels of Margin Debt

At the end of July 2017, margin debt on the New York Stock Exchange reached an all-time high of $550 Billion. 

Prior to the 2007 market correction, NYSE margin debt peaked at 2.63% of GDP. In 2000 margin debt peaked at 2.78%.

NYSE margin debt to GDP now stands at 2.86%.

As the Fed prepares to reduce their holdings of Treasuries and MBS securities on its balance sheet, we may start to see tightening credit conditions in the U.S financial markets and a general withdrawal of market stimulus from the BOJ and the ECB.  


US GDP & 10YR Bond Yields

The technology sector in the US continues to perform against a backdrop of data showing stronger-than-expected growth in the US economy.

The US economy expanded at its most robust pace in more than two years in the second quarter, supported by solid consumer spending and a pickup in business investment.

GDP rose at a seasonally and inflation-adjusted annual rate of 3% in the second quarter.

Interestingly, the bond market remains less than convinced with the 10 year yields retreating to a low of 2.11%, down 50 basis points from their 2017 high of 2.64%.