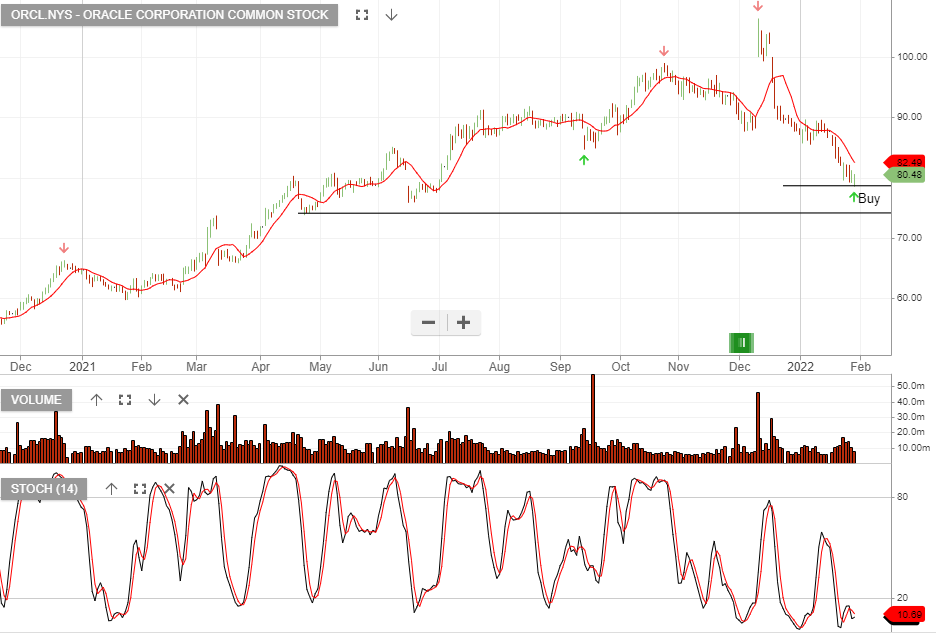
Oracle – Algo Buy
Oracle Corporation Common is under Algo Engine buy conditions and we expect buying support to build above the $80 support level.
.
Oracle Corporation Common is under Algo Engine buy conditions and we expect buying support to build above the $80 support level.
.
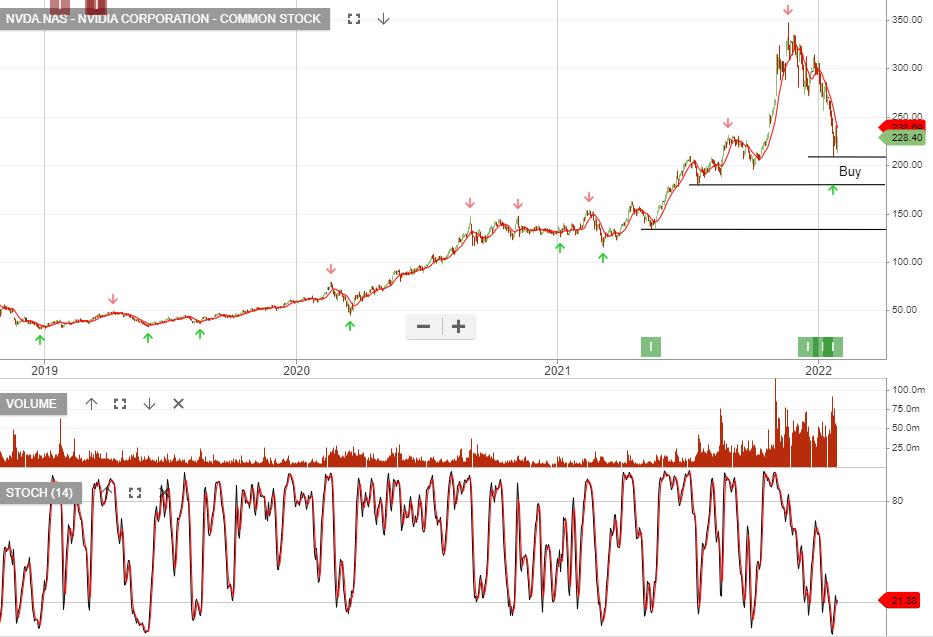
NVIDIA Corporation – Common is under Algo Engine buy conditions. The stock is up 67% since being added in May 2021 and is among the top performers in the US S&P100 model portfolio.
Apply a stop loss on a break below the $208 support.
.
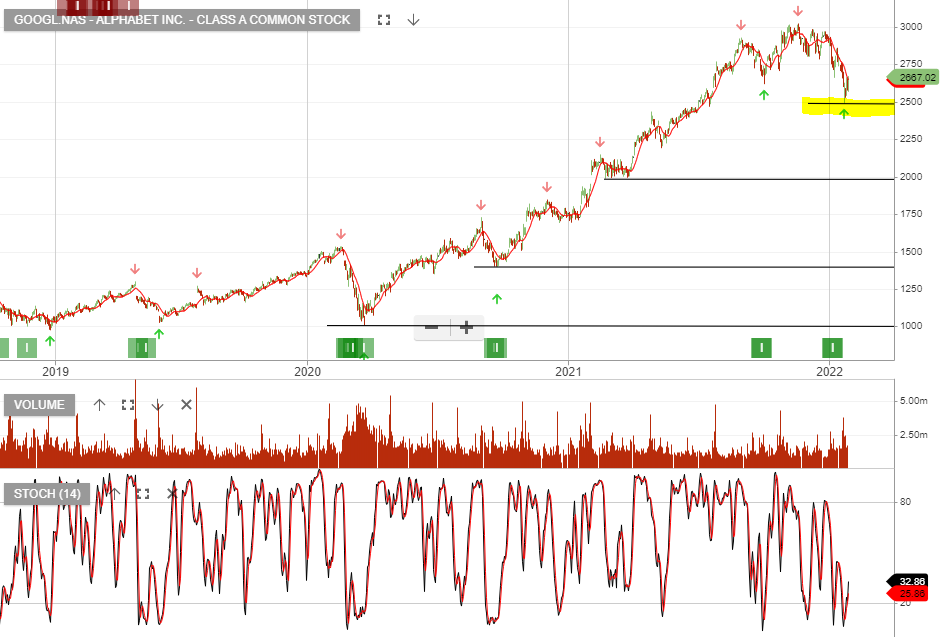
Alphabet Inc. – Class C Capital is under Algo Engine buy conditions. The stock is up 129% since being added in May 2019 and is among the top performers in the US S&P100 model portfolio.
Apply a stop loss on a break below the $2492 support.
.
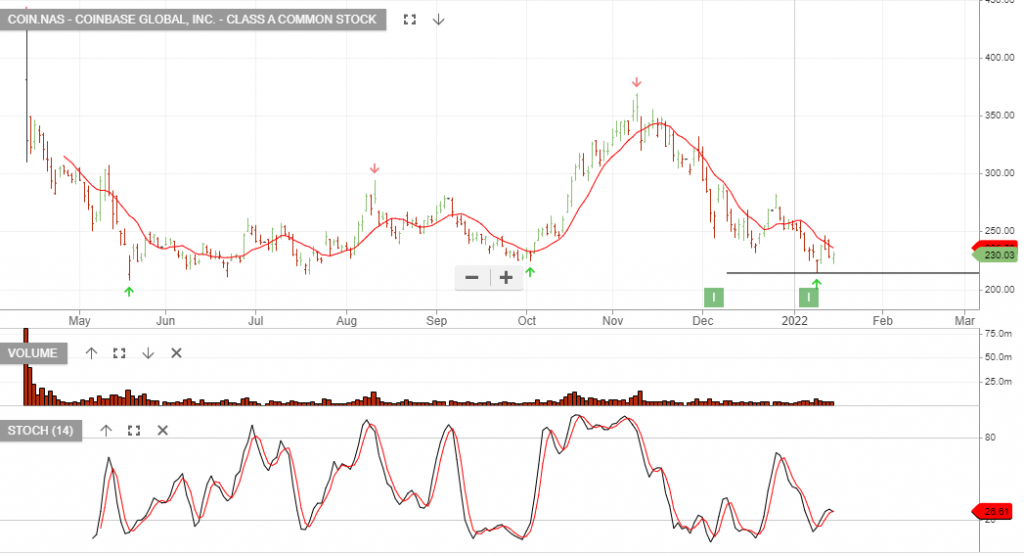
Nasdaq-listed crypto exchange operator Coinbase announced Wednesday that it has acquired Fairx, a regulated derivatives trading platform.
Fairx is regulated by the Commodity Futures Trading Commission (CFTC) as a derivatives exchange or Designated Contract Market (DCM).
“Through this acquisition, we plan to bring regulated crypto derivatives to market, initially through Fairx’s existing partner ecosystem,” Coinbase detailed. “Over time, we plan to leverage Fairx’s infrastructure to offer crypto derivatives to all Coinbase customers in the US.”
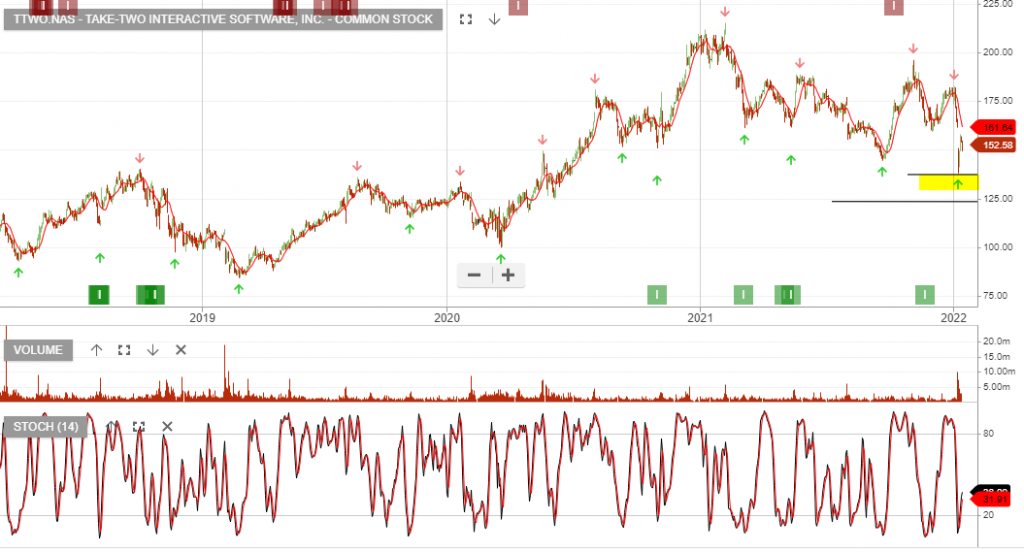
Take-Two announced on Jan 10 that it would be buying Zynga for $12.7b. The current weakness in the share price provides for an attractive entry point.
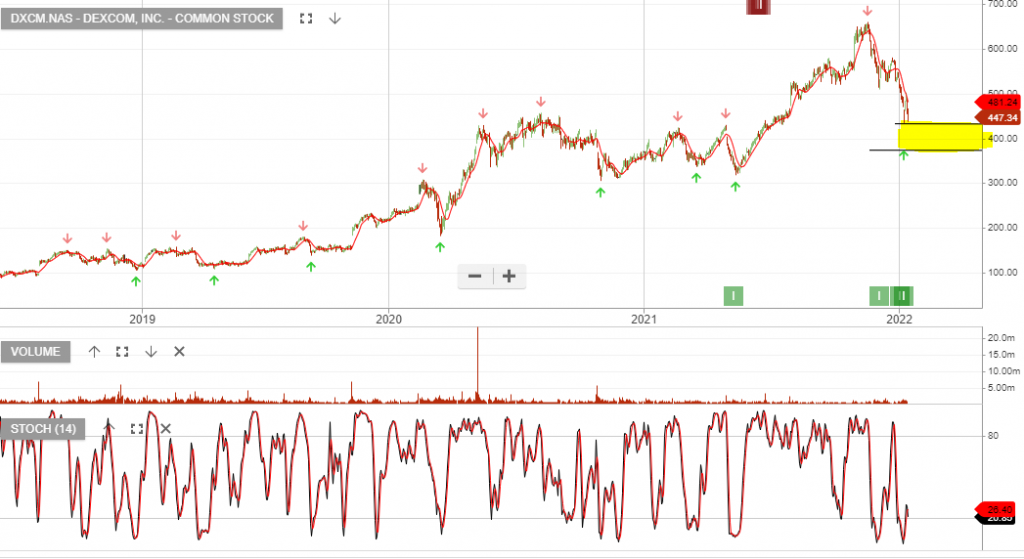
DexCom is a medical device company that focuses on helping diabetes patients achieve better health outcomes. The company currently generates most of its revenue from its G6 continuous glucose monitoring (CGM) system, which helps those with diabetes keep track of their blood glucose levels.
In the first nine months of 2021, the company’s revenue increased 28.9% to $1.8 billion over the prior-year period while net income jumped 25.8% to $174.1 million.
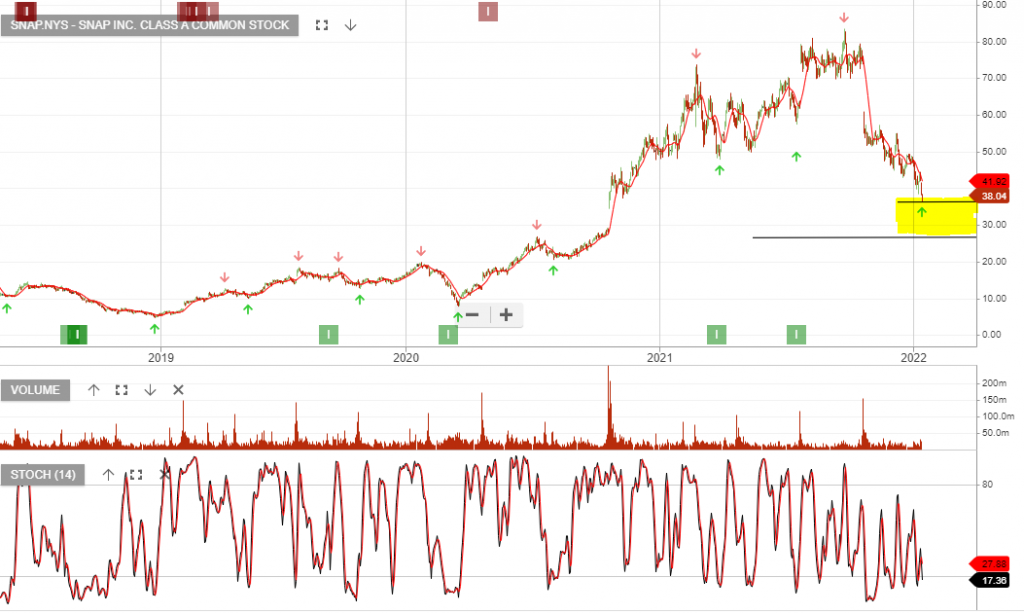
{SNAP.NYS} is under Algo Engine buy conditions. The correction in high PE technology and the negative impact to earnings from the change in Apple’s advertising privacy regulations have seen Snap correct from $80 down to $38. Even after the 50% correction, Snap remains on 80x PE.
Despite the still high PE ratio, Snap offers tremendous growth and we’re accumulating the stock within our defined range.
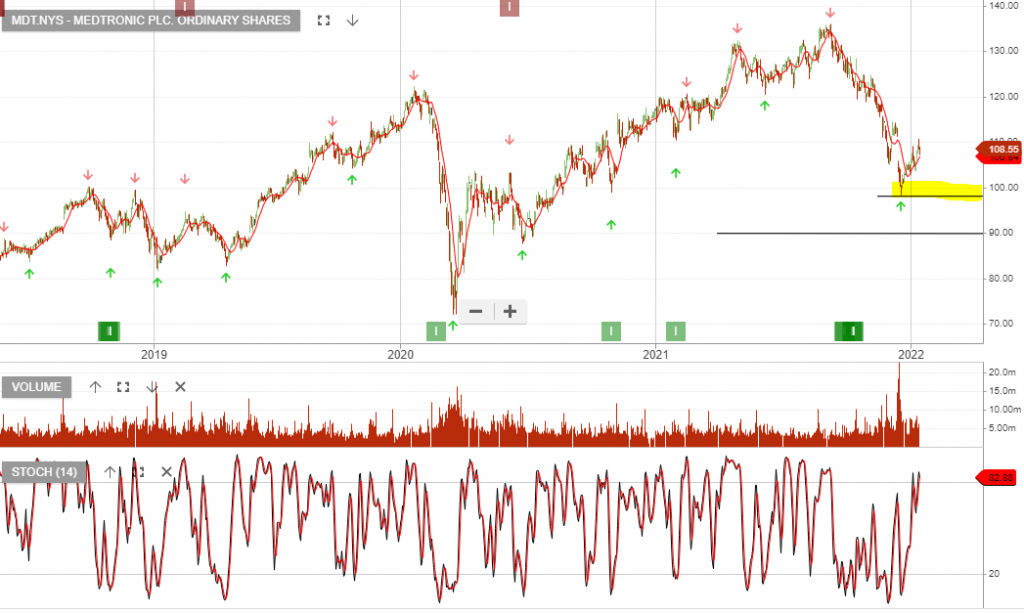
Medtronic plc. Ordinary is under Algo Engine buy conditions. We sell value at $100 and expect to see buying interest remain strong above this price level.
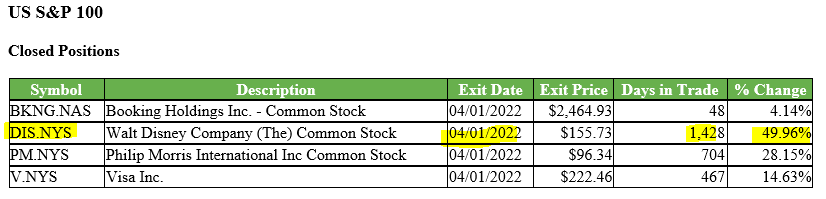
Walt Disney Company (The) Common was sold this week after generating an Algo Engine sell signal at $155.73. The position produced a 49.96% return, since being added back in Feb 2018.
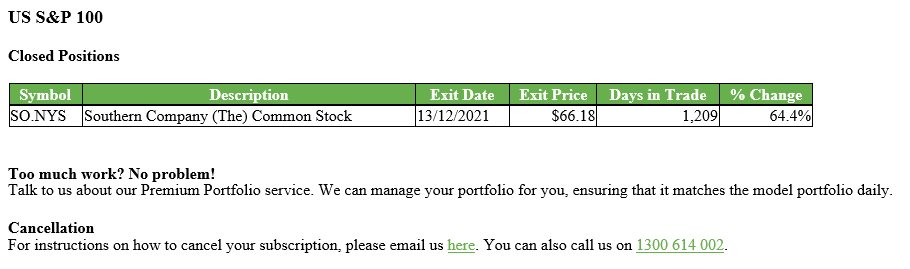
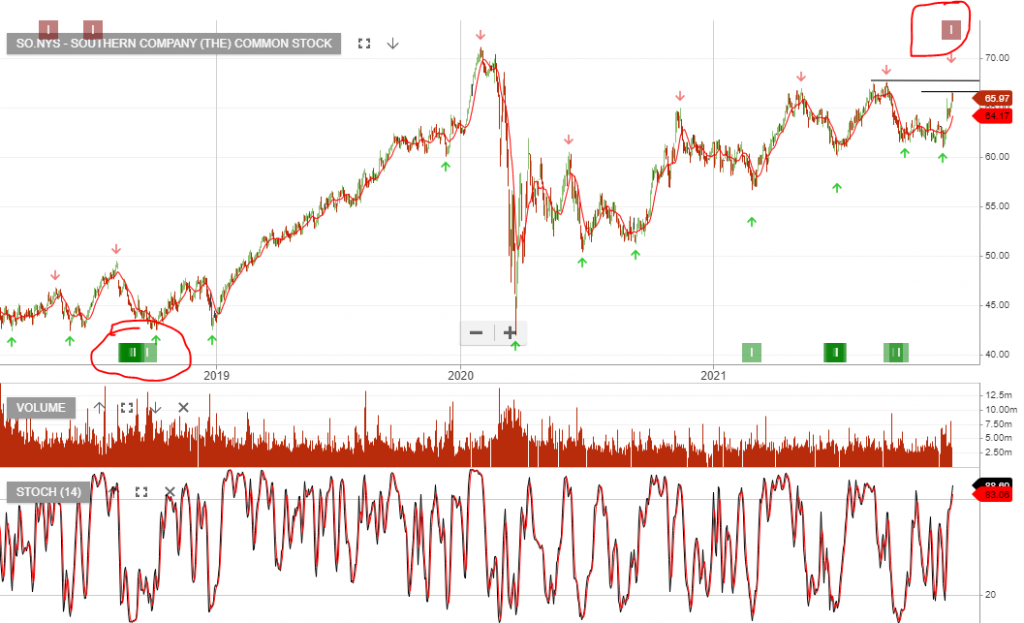
Southern Company (The) Common has been removed from the US S&P100 model portfolio after a 1209 day holding period and a realised gain of 64.4%.
Level 17 Chifley Tower
2 Chifley Square
Sydney, NSW 2000
1300 614 002
Investor Signals Pty Ltd
ABN 44 143 555 453