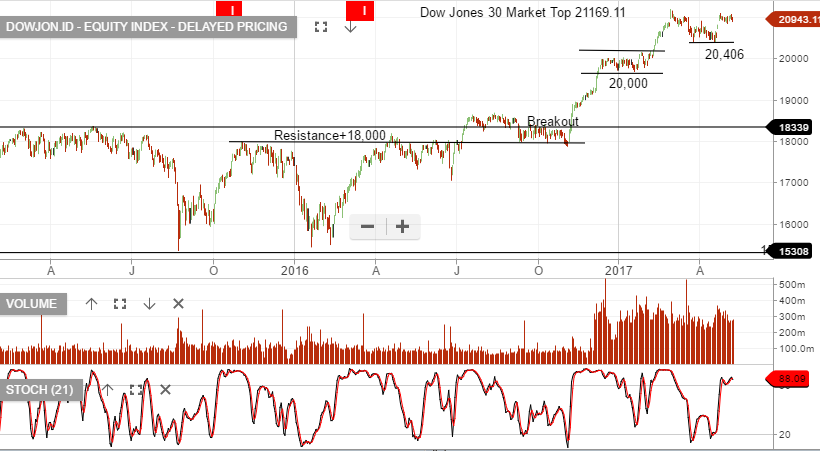
Chart Watch – Dow Jones Index
The Dow Jones index is now trending back towards retesting the high set on March 1st at 21,169.
We remain cautious based on stretched market valuations and a reversal in the index back below 20,798 will be negative.
The Dow Jones index is now trending back towards retesting the high set on March 1st at 21,169.
We remain cautious based on stretched market valuations and a reversal in the index back below 20,798 will be negative.
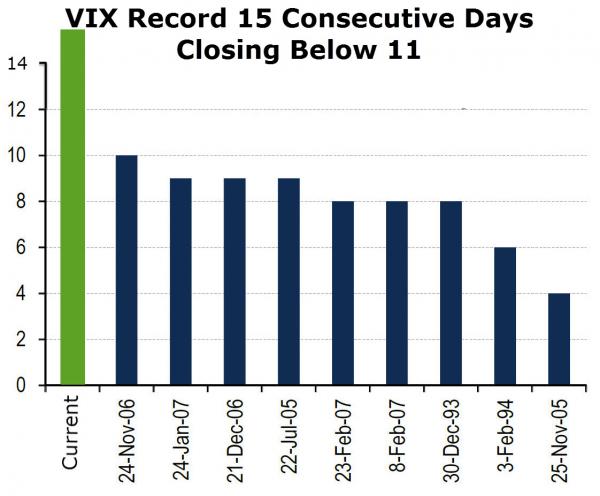
The US stock Volatility Index, or VIX, is the industry benchmark for measuring the implied volatility for stocks in the S&P 500 index. It’s often referred to as the “fear index.”
The VIX is a non-directional indicator, since market volatility will increase whether the S&P Index trades higher or lower.
A low number suggests low volatility, and a low level of “fear” that the collective stocks in the S&P 500 are going to stage a sharp move in either direction.
As of Friday’s NY close, the VIX has settled below 11.00 for 15 consecutive trading sessions. This is the longest streak of market complacency since the VIX started trading in 2004.
VIX Index
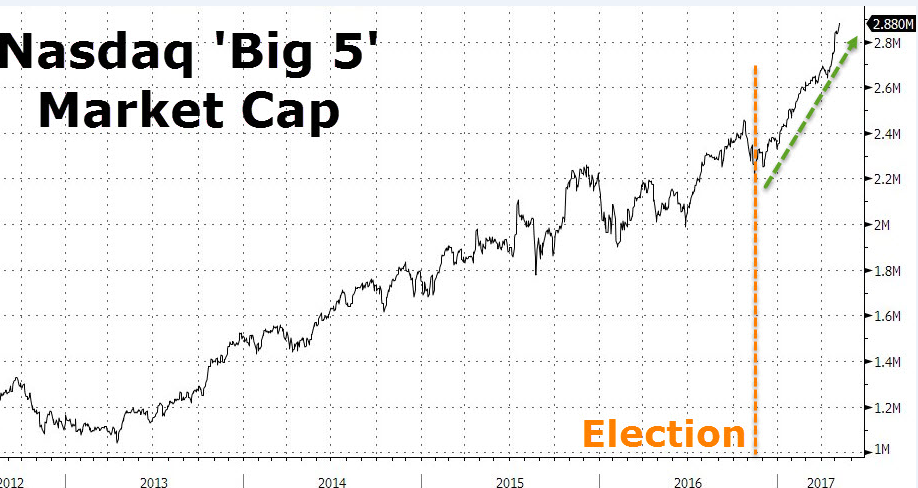
Since the US election in November, the 5 biggest stocks on the NASDAQ: Amazon, Apple, Facebook, Google and Microsoft have gained an extraordinary $675 billion in market capitalization.
This move higher pushes their collective valuations to close to $3 trillion, or over 10% of the entire US market.
To put this into a global context, that’s more than the total value of stocks in any single equity market worldwide except the UK, China, Japan, Hong Kong and the USA.
US Banks have under performed in the last 3 months. With the S&P500 up almost 4% and the banks up on average around 1.5%.
Q1 bank earning reports showed bank loans shrinking since late 2016.
This is likely caused by the first-quarter 2017 GDP growth that was anemic at .7%. Investors are expecting GDP to grow 3% or better during the remainder of 2017, we’re not so sure.
Bank earnings will do well in a environment of 2.5 to 3% plus GDP, anything less than 1% is likely to be problematic. While improving unemployment rates and the Fed’s intentions to raise rates this year, suggest the US economy is doing okay, the slowdown in lending, slowing GDP, rising loan defaults, tighter lending standards may suggest otherwise.

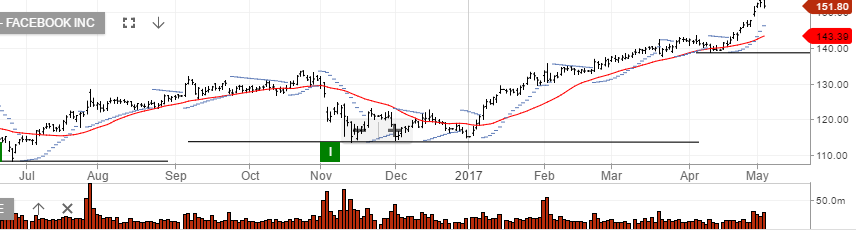
Shares of Facebook are down 2.4% in aftermarket trade to $148.00 after the social media giant released positive earnings, but fell short on expectations of future advertising revenue growth.
The company reported earnings of $1.04 per share on $8.03 billion in revenue versus 60 cents per share on $5.38 billion in revenue in the same period last year.
However, CFO David Wehner repeated his comments from last quarter that advertising revenue would come down “meaningfully”, while payments and other fees revenue fell 3% to $175 million on a year-on-year basis.
Considering the stock has gained over 20% since the beginning of the year, a move back into the $135.00 handle looks like a reasonable downside target.
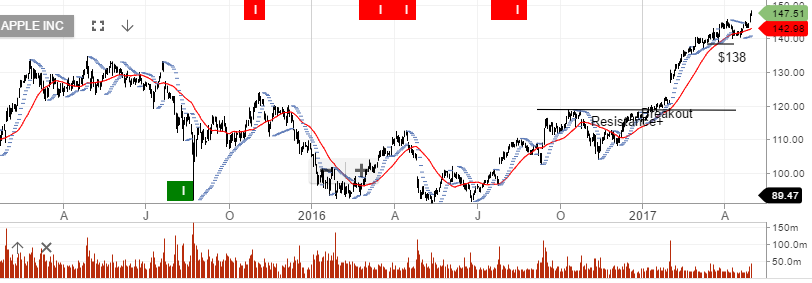
Shares of Apple are trading 1.8% lower in aftermarket trade after a mixed report which beat earnings targets, but fell short on earnings and sales guidance.
The company announced an adjusted EPS of $2.10 versus expectations of $2.02 per share.
However, the revenue number of $52.9 billion was less than the street’s expectation of $53.02. Further, revenue guidance for Q3 has been revised down from $45.6 billion to $43.5 billion.
In addition, gross margins for Q3 are also pointing lower to 37.5% from 38.5%.
Taking into account the 20% rally the stock has seen in calendar 2017 from $118.00 to $147.00, a pullback into the $138.00 handle is a reasonable target.
The next recession will be difficult for Central Banks as already low interest rates, inflated balance sheets & high deficits will likely result in a diminishing effect of policy tools to fight off deflation.
Economy
US GDP has slipped from 2.5% to 0.7% in the March quarter. A long way from the 3.5 or 4% the Trump administration says is achievable. More worrying is GDP appears to be trending lower and now showing only 0.2% growth. The March employment numbers were unexpectedly low, auto sales are dropping due to rising defaults and lenders tightening lending standards. Student loan defaults are rising and mortgage applications are no longer growing.
Many market commentators are dismissing the negative GDP trend as “seasonal issues” and are forecasting a sharp rebound in the June numbers. We’re not so sure and continue to feel that risk assets will soon come under pressure & portfolios should be defensively positioned.
Markets
The bulls will say, yeah but that doesn’t matter, stock prices are rising S&P500 earnings are growing at an average rate of 6%, (ex-energy), and 11% including the rebound in energy related profits, as oil prices recover from this time last year.
Technology giants Microsoft, Google, Apple, Facebook & Amazon are all delivering tremendous earnings growth and this can’t be denied, however, we’ve seen these names suffer during past recessions. They’re not infallible
Conclusion
With the bulk of the S&P500 delivering minimal top line revenue growth, PE’s expanding in a backdrop of falling GDP and rising bad debts, we feel caution is justified.
Local ASX Instruments to consider BEAR, BBOZ, YANK, BBUS & GOLD ETF’s along with Index XJO Puts . Overweight, healthcare, consumer staples, technology & yield sensitive names.
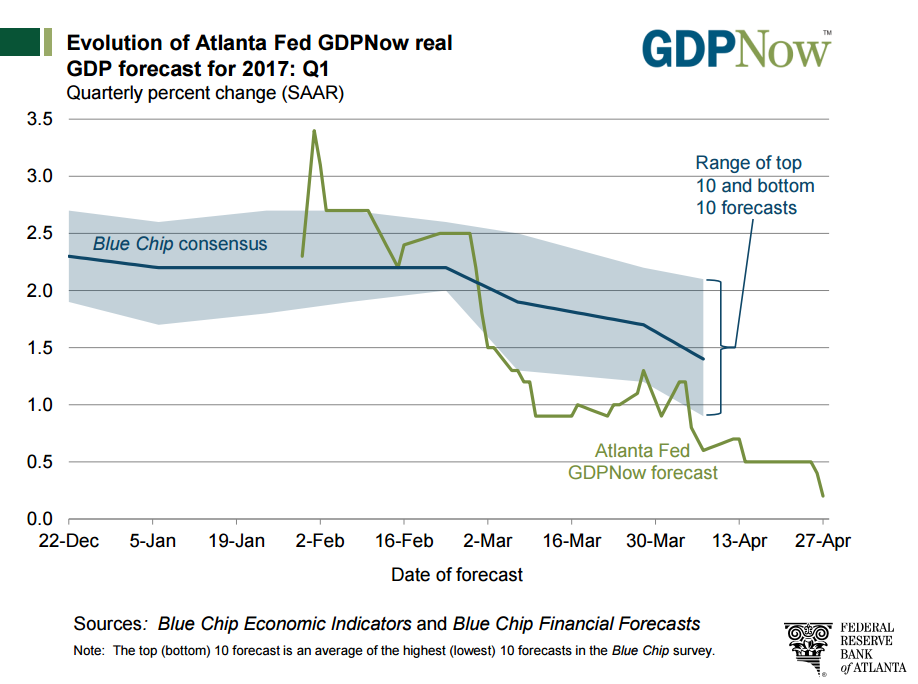
Chart – US GDP Trend
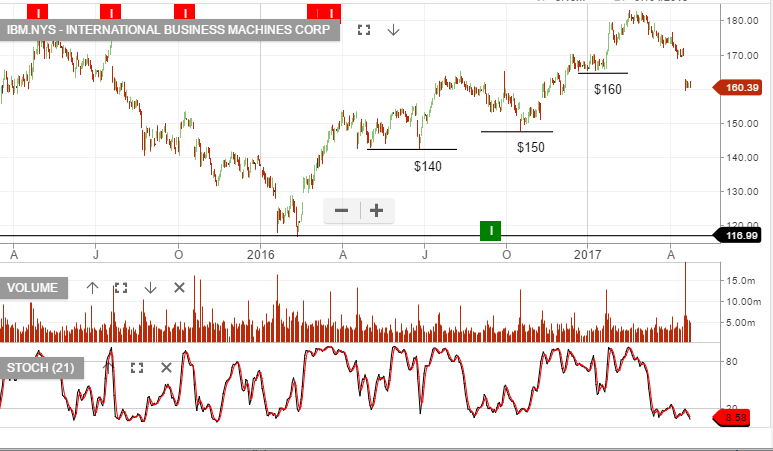
IBM has approximately US$3.8 billion remaining on its current share buy-back plan. Over the last two years, the company has averaged about $4 billion per year in share repurchases .
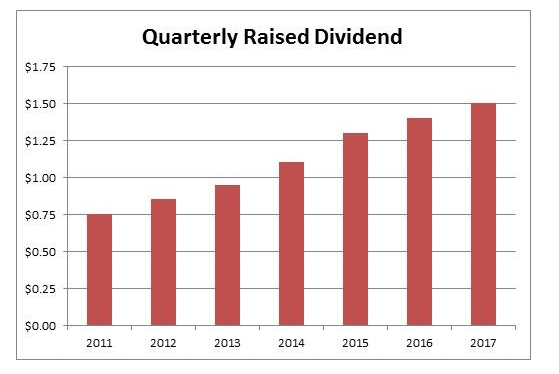
IBM annual yield is now running at around 3.70% or equivalent to US$6.00, that’s well above US Treasuries.
Our Algo Engine generated a buy signal at around $155 back in September last year. Since then, the stock rallied to $183 before last week’s disappointing earnings result caused the stock to sell-off. The price structure looks like we may see a retest of the $150 support level in the near -term.
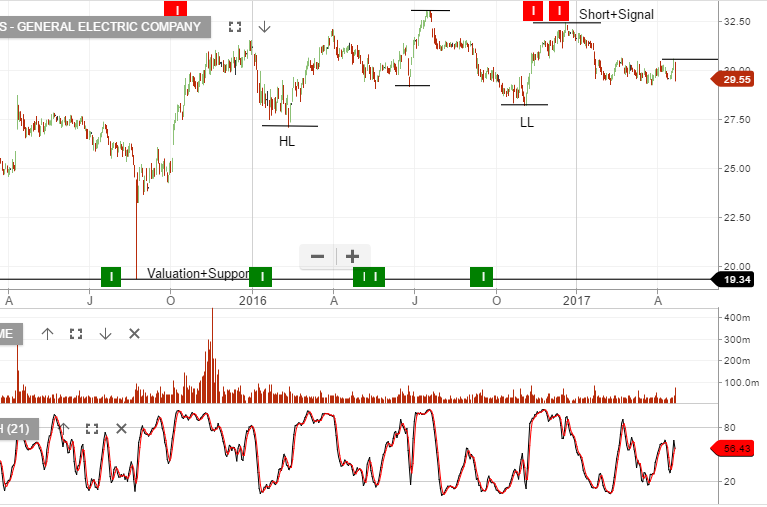
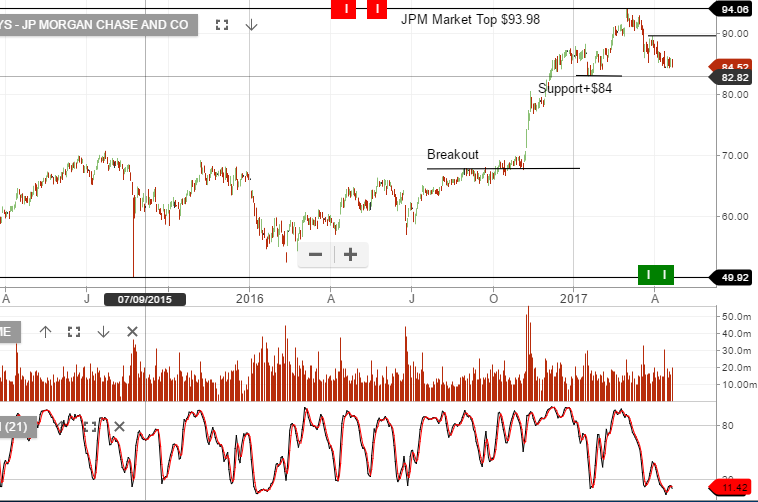
The following charts of Dow Jones’ large caps General Electric and JP Morgan, provide an interesting technical perspective of one of the world’s largest industrial conglomerates and one of America’s largest financial institutions.
GE reported late in the week and at first glance the headline number looked okay, but after digging deeper the free cash flow provided a concern and the stock sold off.
In the case of JP Morgan and other US banks, we’ve watched their share prices sell-off from the March highs as the long end of the yield curve flattens. The implication for banks is, a flattening yield curve will reduce their net interest margins.
US banks have now retraced on average 10%+ from their recent highs.
US earnings season will go into full swing next week with several DOW components and high-capitalization S&P 500 companies reporting Q1 earnings.
Thus far, the results have been mixed with IBM missing badly and forward guidance on the major US banks showing concerns for future revenue growth.
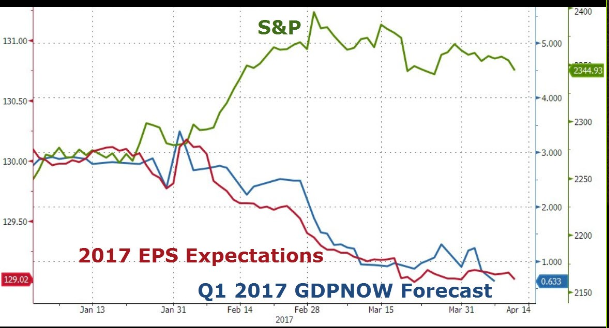
The chart below shows that the expectations of S&P earnings, relative to the current pricing of the S&P 500 index, are very much out of line.
If next week’s earnings reports don’t exceed expectations, we could see further downside range extension on the SP 500 index, which could pressure the XJO index lower.
We have been looking at the May 5800 XJO puts as a short-term portfolio hedging instrument for a move lower in the local market.
We have also been buying the BetaShare BBOZ inverse exchange traded fund. Shares in BBOZ gain value as the local market trades lower.
Level 17 Chifley Tower
2 Chifley Square
Sydney, NSW 2000
1300 614 002
Investor Signals Pty Ltd
ABN 44 143 555 453