US Markets – Chart Update
US Stock Indexes closed lower on Friday as option expiration and continued weakness in the financial sector offset gains in the industrial and utility names.
The Financial index finished the day over 1.5% lower with the major banks stocks: JP Morgan, Goldman Sachs, Citi Group and Bank of America all falling by more than 1% by the New York close.
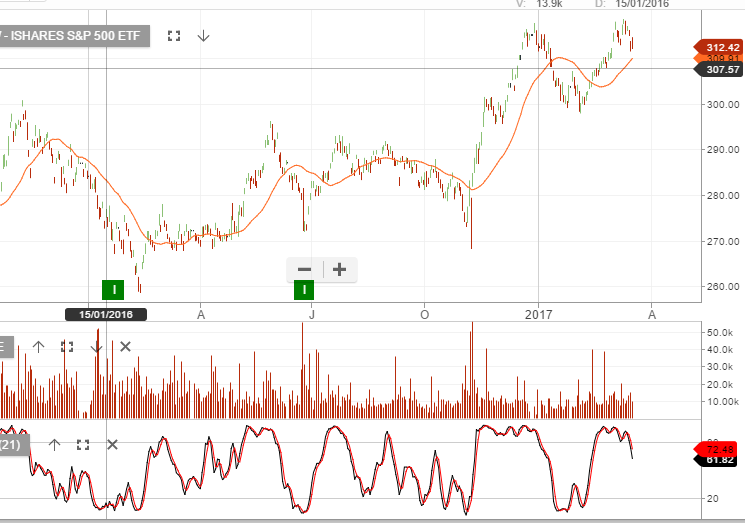
With the SP 500 index now trading at 22 X earnings on a forward yield of just under 2.5%, the medium-term fundamentals don’t appear to support the high level consolidation at these prices.
Technically, the SP 500 index has not closed below the 30-day moving average in over 4 months.
We now see key price support at 2356.00. A break of this level would likely extend back to the February 13th low of 2310.00.
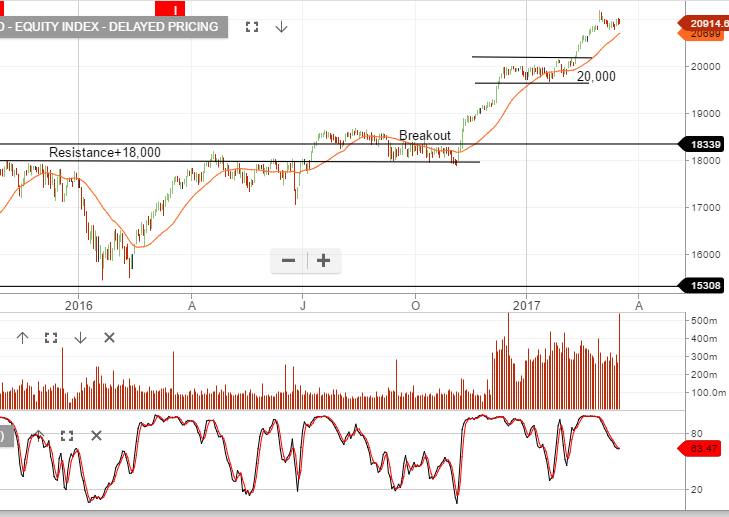
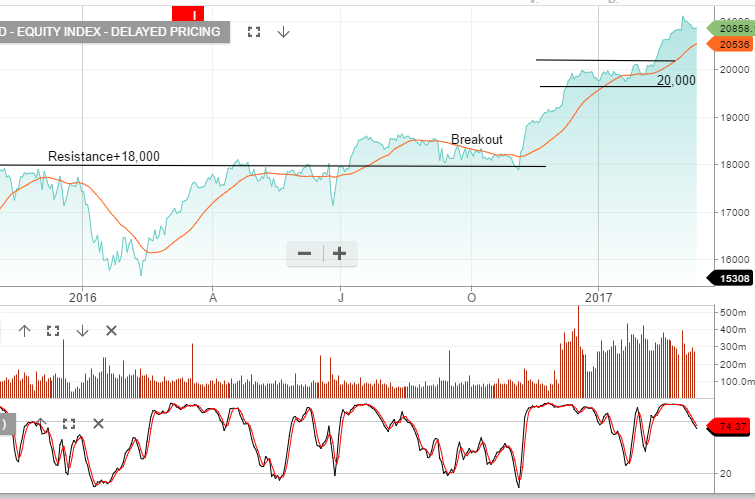
Chart below of Dow Jones Index and S&P500