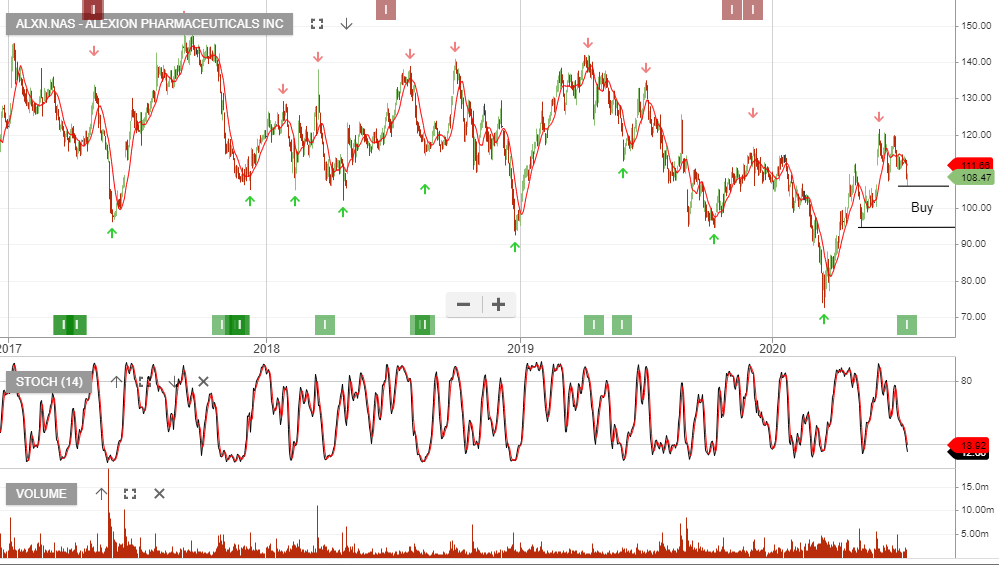
ETF Watch – IVV ETF (S&P500)

The IVV ETF is based on the S&P500 index in the US, the chart shows the market remains in a bullish higher low structure.

Investors continue to chase equity valuations higher as US GDP deteriorates.

Chart – IVV

The chart below is the BetaShares NASDAQ 100 ETF. Our Algo Engine triggered a buy signal in early 2016 when the ETF was trading at $10, it is now trading $13.50.


Lockheed Hits All-Time Highs On Saudi Deal

Shares of Lockheed Martin (LMT) reached an all-time high of $280.00 as the defence contractor agreed to a deal with Saudi Arabia worth $28 billion.

This deal alone is enough to cover the company’s revenue for over 6 months

LMT is one of the key beneficiaries of a total arms package which will be worth over $350 billion over the next 10 years.

Among other products, the deal includes the sale of 150 Black Hawk helicopters, systems for air defence, tactical aircraft and combat ships.

Lockheed Martin

Chart Watch – Goldman Sachs

Goldman Sachs has sold  off $40 since the high created on the 1st of March. The chart image below shows price action is now finding minor support within a weakening short-term channel.

We’ll continue to watch the chart pattern unfold with anticipated resistance back up at $230.

The relevance of tracking GS for local investors, is it may provide an indication  as to when our local banking & finance stocks will find new selling pressure, should they have a minor bounce from yesterday’s lows.

Chart – Goldman Sachs


ETF Watch – IVV (S&P500)

The IVV is an iShares ASX listed ETF that provides exposure to the S&P500 index of stocks.

Our Algo Engine has triggered multiple buy signals over the past 3 years and so far, no sell signals. However, with the index at 18x earnings and deteriorating global economic data, we feel now is an opportunity to lock-in gains and wait for the next Algo Engine buy signal.

Chart – IVV


US Equities & Bonds

The US 10 YR treasuries  have fallen from 2.62% yield, to now trading at 2.23%. US economic data is deteriorating and the bond market is suggesting that a June rate hike is now less probable.

Lower bond yields make it more difficult for banks to expand their net interest margins.

The following graphs show the recent trends in GE and Goldman Sachs. We’ve been following GE since January as a leading indicator of the headwinds facing global industrial companies.  We’re now seeing this weakness manifest in the beginning of a more broad based equity market sell-off.

Chart – GE
Chart – Goldman Sachs


VIX Index Posts New Record Low

The US stock Volatility Index, or VIX, is the industry benchmark for measuring the implied volatility for stocks in the S&P 500 index. It’s often referred to as the “fear index.”

The VIX is a non-directional indicator, since market volatility will increase whether the S&P Index  trades higher or lower.

A low number suggests low volatility, and a low level of “fear” that the collective stocks in the S&P 500 are going to stage a sharp move in either direction.

As of Friday’s NY close, the VIX has settled below 11.00 for 15 consecutive trading sessions. This is the longest streak of market complacency since the VIX started trading in 2004.

VIX Index


US Big-5 Worth Close To $3 Trillion

Since the US election in November, the 5 biggest stocks on the NASDAQ: Amazon, Apple, Facebook, Google and Microsoft have gained an extraordinary $675 billion in market capitalization.

This move higher pushes their collective valuations to close to $3 trillion, or over 10% of the entire US market.

To put this into a global context, that’s more than the total value of stocks in any single equity market worldwide except the UK, China, Japan, Hong Kong and the USA.