The next recession will be difficult for Central Banks as already low interest rates, inflated balance sheets & high deficits will likely result in a diminishing effect of policy tools to fight off deflation.
Economy
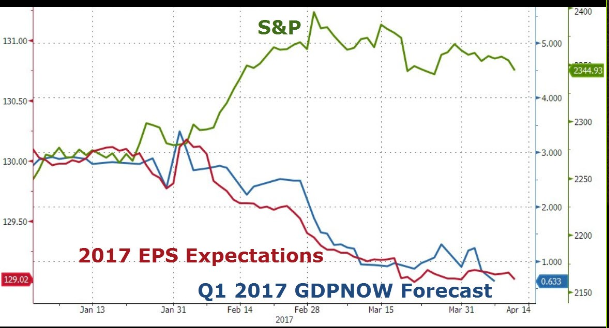
US GDP has slipped from 2.5% to 0.7% in the March quarter. A long way from the 3.5 or 4% the Trump administration says is achievable. More worrying is GDP appears to be trending lower and now showing only 0.2% growth. The March employment numbers were unexpectedly low, auto sales are dropping due to rising defaults and lenders tightening lending standards. Student loan defaults are rising and mortgage applications are no longer growing.
Many market commentators are dismissing the negative GDP trend as “seasonal issues” and are forecasting a sharp rebound in the June numbers. We’re not so sure and continue to feel that risk assets will soon come under pressure & portfolios should be defensively positioned.
Markets
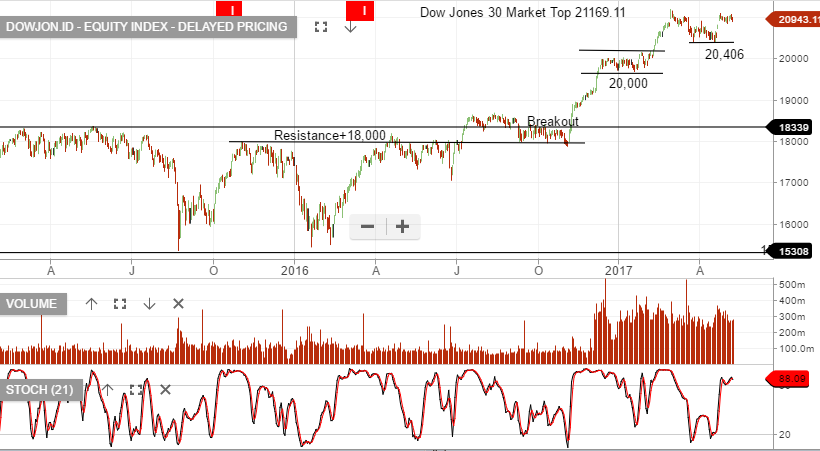
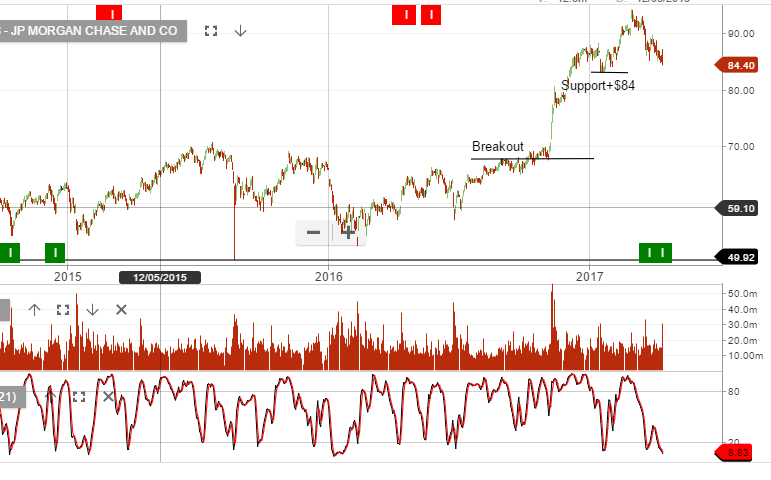
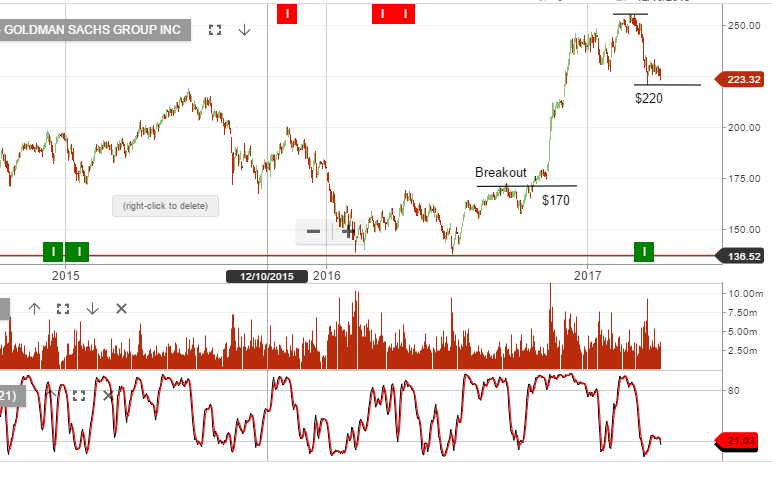
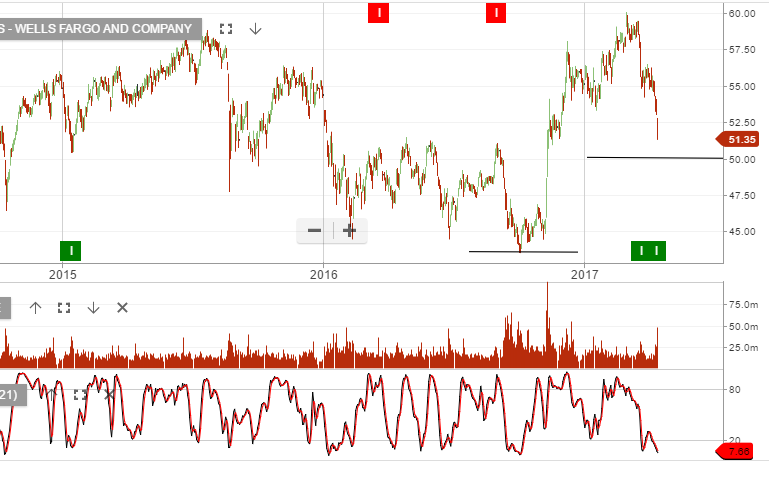
The bulls will say, yeah but that doesn’t matter, stock prices are rising S&P500 earnings are growing at an average rate of 6%, (ex-energy), and 11% including the rebound in energy related profits, as oil prices recover from this time last year.
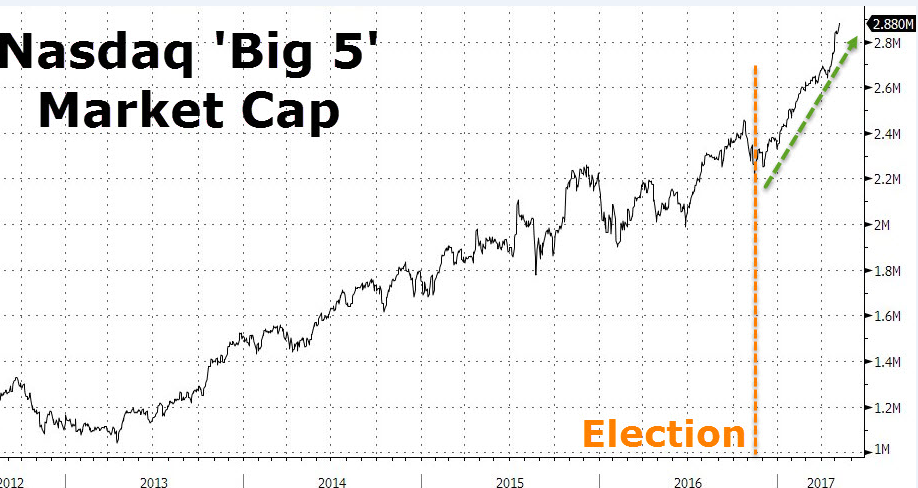
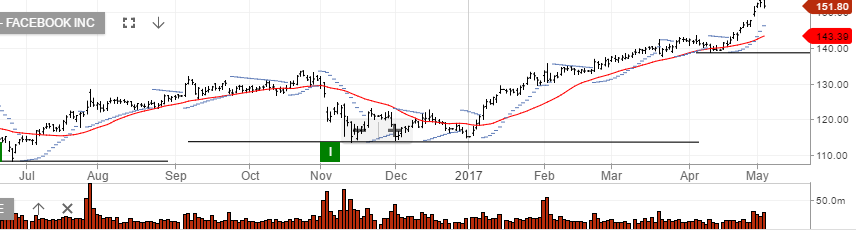
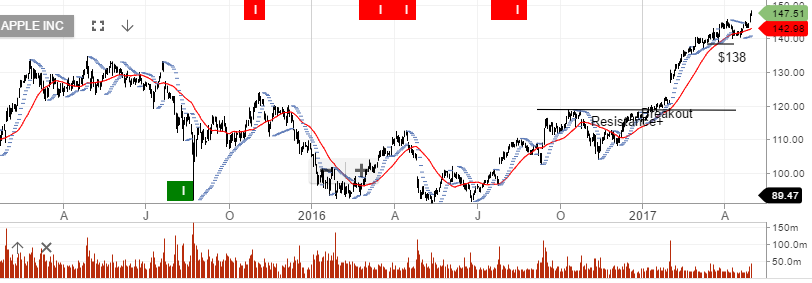
Technology giants Microsoft, Google, Apple, Facebook & Amazon are all delivering tremendous earnings growth and this can’t be denied, however, we’ve seen these names suffer during past recessions. They’re not infallible
Conclusion
With the bulk of the S&P500 delivering minimal top line revenue growth, PE’s expanding in a backdrop of falling GDP and rising bad debts, we feel caution is justified.
Local ASX Instruments to consider BEAR, BBOZ, YANK, BBUS & GOLD ETF’s along with Index XJO Puts . Overweight, healthcare, consumer staples, technology & yield sensitive names.
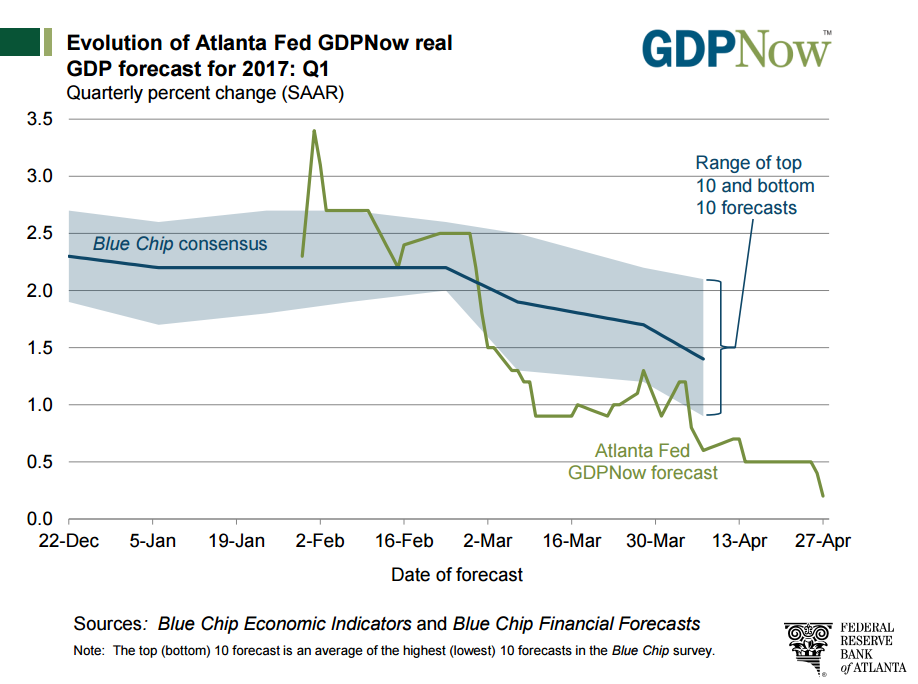
Chart – US GDP Trend