Global Macro
While there was never a consensus that the FED was going to lift the overnight target rate going into last week’s FOMC meeting, there were a couple primary dealers who cautioned that the FED might surprise the market. And while a .25% increase might not have much of an impact on the overall economy, it could have had a significant impact on global equity markets. Remember the sharp sell-off that the SP 500 experienced after the last rate hike in December, 2015. As such, we feel it would be helpful to have some idea of when the next rate adjustment is approaching, so that we could plan our investment strategy accordingly.
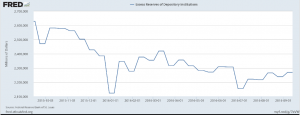
One indicator that might give us some insight as to what the FED is planning on doing, as opposed to what it’s saying its doing, is the change in excess reserves held by banks. As you can see on the chart, the level of excess reserves fell considerably in the weeks leading up to the first step in interest rate normalization late last year. Starting in early November, excess reserves fell by over $200 billion in advance of the FED’s decision to raise short-term rates by .25% in December.
The FED used its reverse repurchase agreement facility (reverse repos) to drain excess reserves by exchanging Treasury securities on its balance sheet for reserves held by banks, thereby removing liquidity in the financial system which is consistent with a tighter monetary policy. Going forward, we believe it’s worthwhile to follow the repo market for signs that excess reserves are leaving the financial system as a signal that the FED is preparing further interest rate normalization later this year.
Graph of Excess Reserves of Depository Institutions.
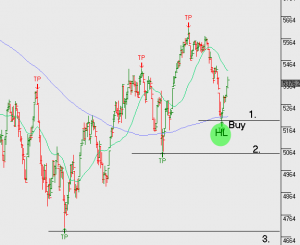
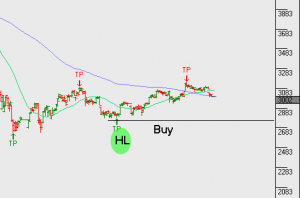
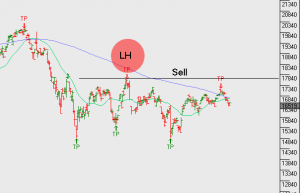 Hang Seng
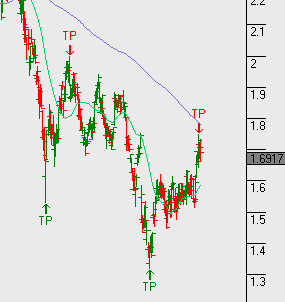
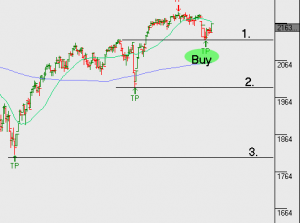
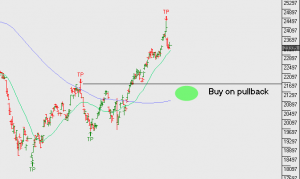 Shanghai Composite
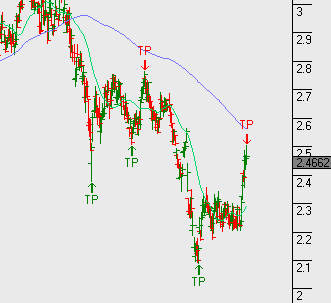