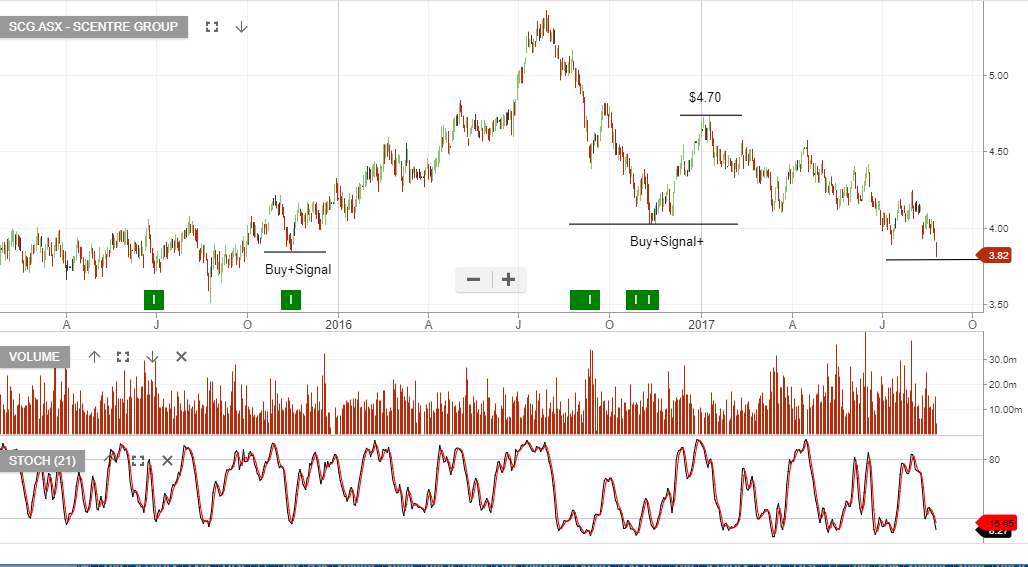
Scentre Group 1H17 Earnings
Scentre Group reported 1H17 profit growth of 3.5% compared to the same time last year.
We have the stock trading on a 5.5% yield, based on FY18 distribution of 22 cents per share.
Scentre Group reported 1H17 profit growth of 3.5% compared to the same time last year.
We have the stock trading on a 5.5% yield, based on FY18 distribution of 22 cents per share.
When AGL was trading at $27 back in April, we were warning that the stock was overvalued and suggested that fair value was back at $22.
AGL is now trading $23 and members should be watching for a buy range to develop.
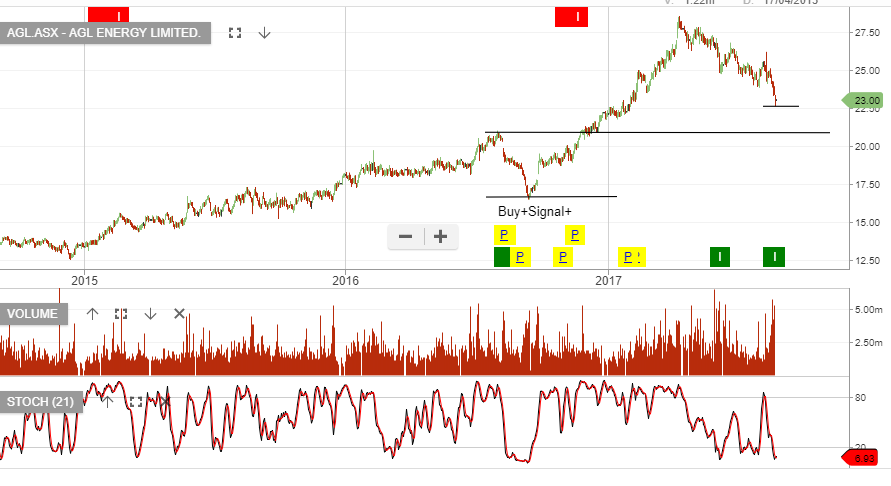
AGL
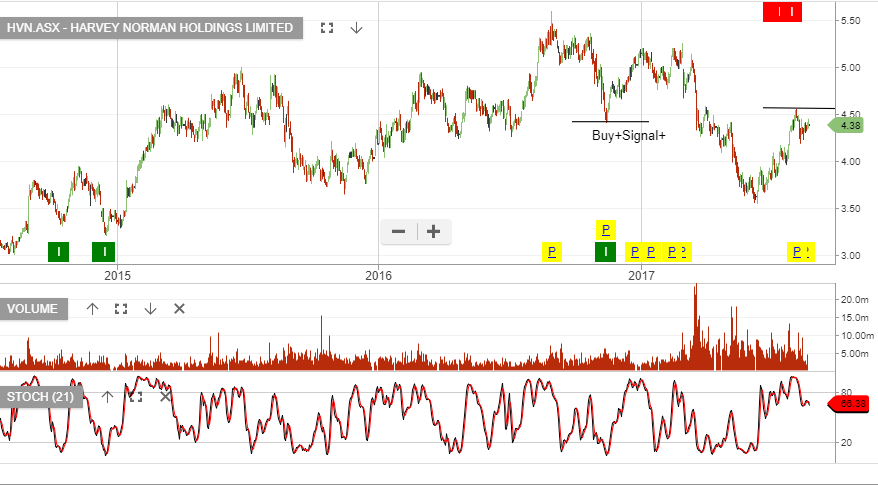
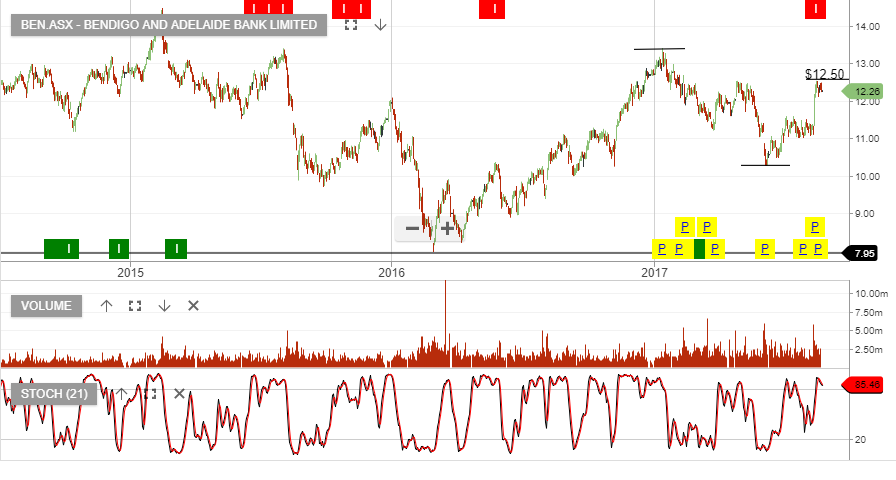
We like the short side of the banks and retailers coming into what will likely be a volatile period for equity markets in September & October.
The regional banks, BOQ & BEN look expensive.
Following their profit announcement on the 31st August, HVN should be on your wishlist as a potential short, with a stop losses above recent highs.
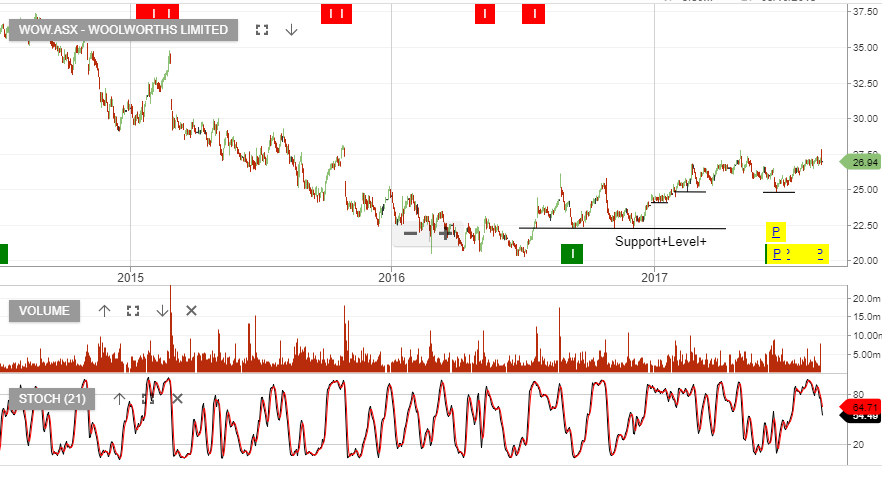
Woolworths announced FY17 underlying NPAT of $1.42 billion, down 3.6% and the company declared a final dividend of 50 cents, which includes the one-off item from the sale of Masters. The higher dividend is not likely to recur in FY18.
The market is now looking for WOW to grow NPAT in the range of 5 – 8% and payout approximately $0.90 in full year distributions, placing the stock on 22x forward earnings and 3.1% dividend yield.
We feel WOW is now fully valued and holding the stock can only be justified when an at-the-money covered call is overlaid to boost the annualised cash flow to 10 – 12%.
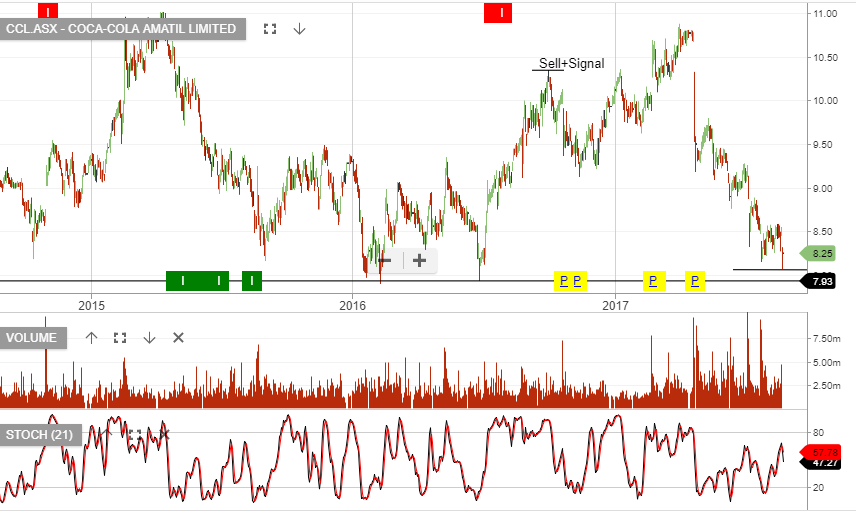
Coca Cola announced 1H17 underlying NPAT fell 4.3%, to $190 million. The company declared an interim dividend of 21 cents, which is 75%
franked.
Forward guidance suggest relatively flat EPS will continue with full year NPAT expected to be $420 million.
Indonesia and PNG are delivering improved earnings metrics and we have the company on a forward dividend yield of 5.4%, assuming 44 cents in annualised DPS.
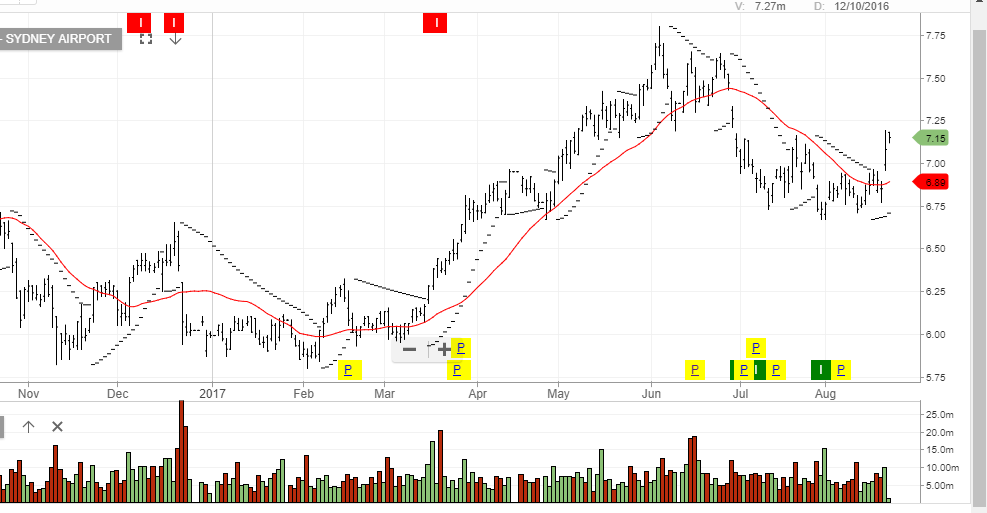
Shares of Sydney Airports (SYD) are still well bid over $7.00 after the company announced 1H17 results, which included EBITDA of $577 million , cash flow of $383 million and an upgraded dividend guidance from 33.5 cents to 34.5 cents for calendar year 2017.
This strength in cash flow and increased dividend puts SYD on a dividend yield of 4.9%.
We expect strong price resistance in the $7.30 area and consider the stock expensive in the $7.30/50 area.
Considering the extended market conditions, in general, we prefer a at-the-money buy/write strategy for SYD to enhance portfolio returns on a stock with modest upside potential.
 Sydney Airports
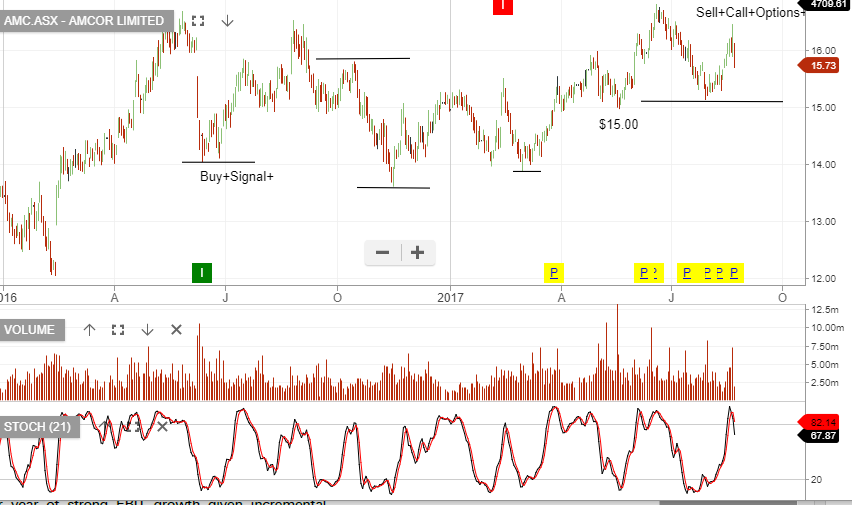
AMC has delivered FY17 operating earnings of $1.09 billion, up 3% on FY16. The Board declared a final dividend of $0.235.
Underlying net profit for the 12 months to June, came in at $700 million or 4.5% higher on the same time last year.
At 19x forward earnings, AMC is expensive.
However, earnings are defensive and the company should still achieve average EPS growth of 8% into FY18, (net profit in the range of $750 – $770 million), placing the stock of a forward yield of 3.7%.
We expect AMC to trade within a range of $15.00 to $16.50.
Amcor
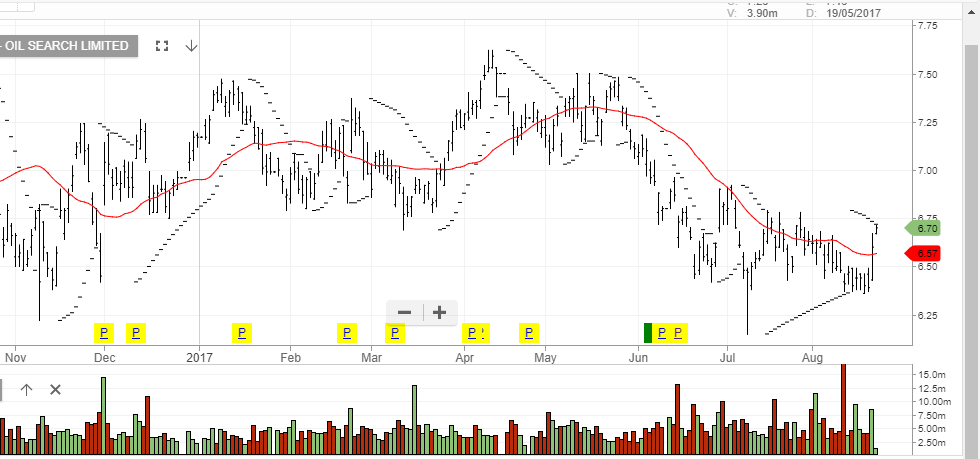
Shares of Oil Search got as lift yesterday as the company announced 1H17 results, which included an underlying NPAT of USD129 million and a higher-than-expected dividend of USD 4 cents per share.
Total profit increased to AUD7.30 per share. OSH management also tightened guidance towards the higher end of production, and the lower end of costs and capital expenditure for the calendar year 2017.
The company expects the PNG LPG yearly production rates over 8.6 metric tons per annum, which is the top end of the last year’s guidance.
OSH shares have lost over 15% since trading at $7.50 in mid-April.
We see scope for a medium-term lift from the $6.30 support area, but would consider the company a buy/write opportunity at current levels.
 Oil Search
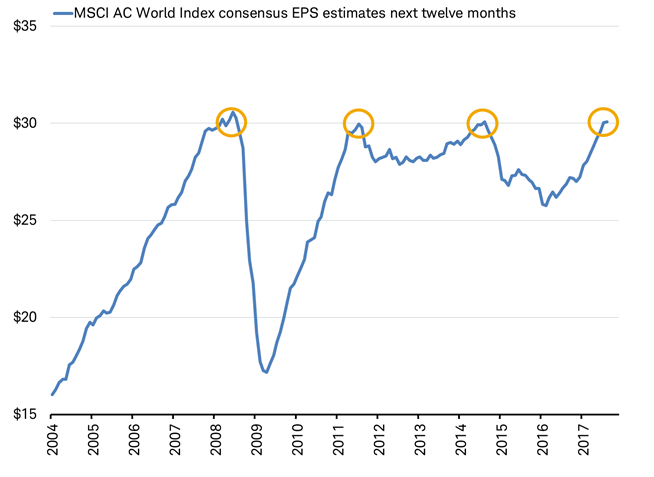
Global equity market price-to-earnings ratio are now trading at a 15 year high and average earnings per share sit at prior peak levels.
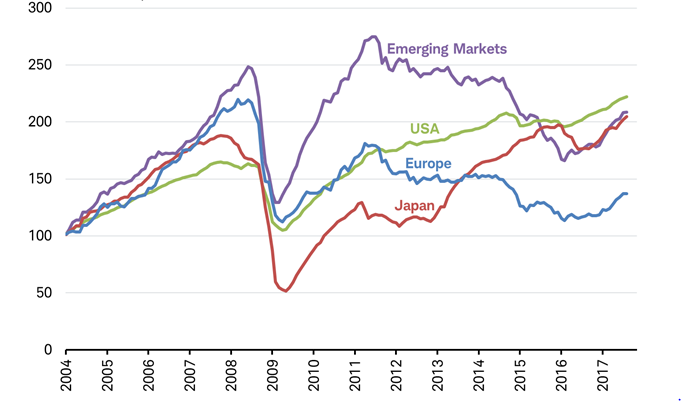
The World Bank forecasts that global growth will strengthen to 2.7 % in 2017 amid a pickup in manufacturing and trade, rising confidence, favorable global financing conditions, and stabilizing commodity prices.
Growth in advanced economies is expected to accelerate to 1.9 % in 2017, a benefit to their trading partners. Growth in emerging market and developing economies will recover to 4.1 % this year, as obstacles to activity diminish in commodity-exporting countries.
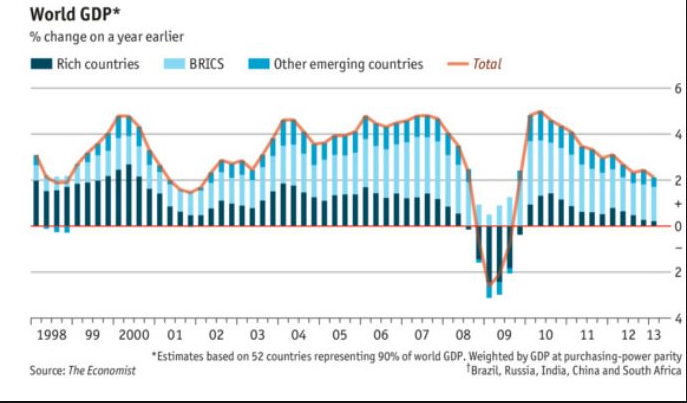
Looking at the graph below, investors can see the difficulty the global economy has had in maintaining GDP growth.
We consider this an interesting contradiction to record PE valuations and EPS growth. For the most part, this is best explained through understanding the impact of share buy-back programs, helping to deliver financially engineered EPS growth.
Up until last week, US Stocks had spent the last five months gradually moving higher, without many big daily gains or losses.
They had drawn strength from rising U.S. corporate profits and continued growth in the economy, along with recoveries in Europe and other EM regions.
It’s clear that investors still believe that if the global economy or equity markets ran into serious trouble, G-7 central banks would step in to help, just as they did after the 2008-09 global financial crisis.
Given the historically low volatility measures in the markets, it’s not surprising that on August 7th, a small 52 point rally (essentially all from Apple Inc) brought the Dow Jones 30 Index to its newest milestone of 22,062.
But this new record high belies the growing unevenness of the index.
Shares of Boeing, McDonald’s and health insurer United Health have contributed more than 700 points of the 1,000 points the Dow has gained since March 1, when the index topped 21,000 points for the first time.
This means that 10% of the components of the Dow index have been responsible for 70% of the overall gains over the last five months.
Meanwhile, Goldman Sachs and IBM, which helped lead the Dow’s surge in late 2016 and early 2017, have come crashing back to earth and are currently the worst performers in the Dow index this year.
A 1,000-point rally in the Dow 30 isn’t what is used to be a few years ago. As the index trades higher, each round-number milestone represents a smaller percentage move.
When the Dow advanced from 10,000 points to 11,000 points in early 1999, it was a 10% rally. By contrast, the move from 21,000 to 22,000 translates to a gain of just 4.8%.
The Dow index is more than 120 years old, and experts and market-watchers constantly debate how accurately it represents the overall health of the market. With only 30 companies in the index, the Dow reflects much less of the broad economy than the Standard & Poor’s 500 index, the NASDAQ or the Russell 2000, which institutional investors pay more attention to.
From a technical perspective, Dow points are also based on the individual stock price instead of the relative value of the company.
So a 1% move for an expensive stock like Boeing or Goldman Sachs, both priced well above $200 per share, will move the Dow Index more than Microsoft, worth around $70 per share, even though Microsoft has a capitalization of more than $550 billion compared to about $90 billion for Goldman Sachs.
This type of internal price dispersion is not limited to the narrow Dow 30 Index. Internal price dispersion has now become apparent in the SP 500 Index, which, as a much broader index, has much more significant ramifications for future share price valuations.
For example, a growing proportion of individual stocks in the SP 500 are now priced below their respective 200-day moving averages, with just a handful of names carrying the index higher over the last few months.
This widening divergence in leadership, (as measured by the proportion of individual stocks hitting new highs versus new lows), is not a bullish indicator for US stocks going forward.
The chart below illustrates the percentage of U.S. stocks above their respective 200-day moving averages, compared with the S&P 500 Index. The deterioration and widening dispersion in market internals is no longer subtle and points to price momentum turning lower.
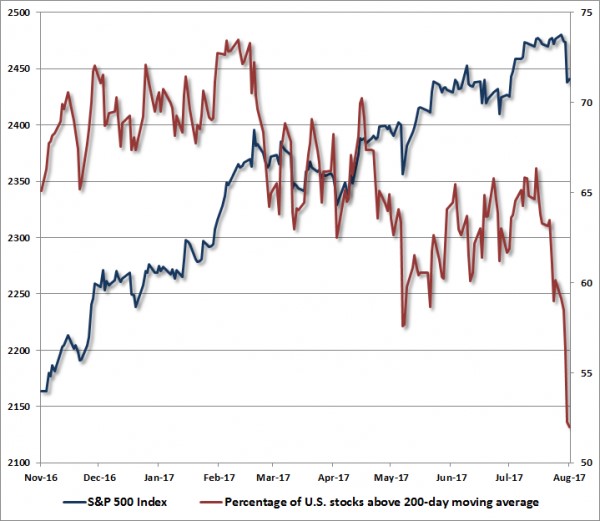
Further, this degree of dispersion suggests that not only is risk-aversion rising, it is also picking up pace.
Across history, this sort of shift in individual share prices, coupled with extreme overvalued P/E’s and over-bullish sentiment, has been the hallmark of major price peaks and subsequent market corrections.
Looking across the financial landscape, we see several other potential triggering events which could signal a material correction in global equity markets. Of these potential market inflection points, five stand out as troubling and worth noting.
Within this list, the most severe market event would be the failure of the US Congress to raise the debt ceiling in time to prevent a shutdown of the US Government: this event caused 16% drop in the US SP 500 in 2011, as referenced in our August 14th blog report titled “Black Monday 2011, revisited.”
On August 1st, the US Treasury Department announced that the debt ceiling, (the statutory limit of outstanding debt obligations that the federal government can hold), must be raised by September 29th. After lawmakers return from their summer break, that will give Congress 12 working days to pass legislation to get to President Donald Trump’s desk.
If this deadline is breached, it could lead to disastrous consequences for the Federal government, the US economy, and the global financial system. If the debt ceiling is not raised, the US government would lose the ability to pay bills it already owes in the form of US Treasury bills and could lead the US to default on some of that debt.
The possible fallout from a default, according to a recent study by the Treasury Department, would include a meltdown in the stock and bond markets, a downgrade of the US’s credit rating and the undermining of the full faith and credit of the country.
It’s our base case that despite the potentially dire consequences, there is some confidence but no guarantee that factions in Congress, with a variety of competing interests, will be able to come together on a deal to raise the limit.
And even though the US Government has raised the debt ceiling 78 times over the last 57 years, the political uncertainty in Washington is making investors realize that the chances of successfully negotiating the debt ceiling legislation without a Government shutdown are dwindling.
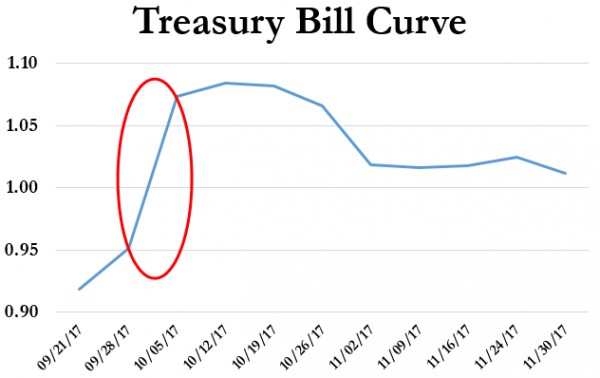
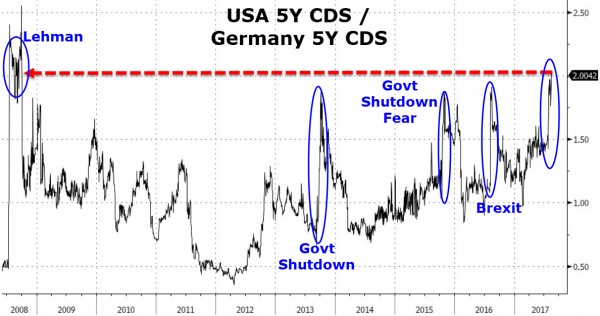
Institutional investors in the US Credit markets have already started pricing in a Government financial disruption as illustrated in the spike in US credit default risk and the inversion in the US T-Bill curve.
Unfortunately, based on recent negotiations for Health Care and Tax reforms, the Congress has not proven that it’s lawmakers are motivated to do what’s best for the American people, or that it can get anything done.
What’s more, the debt ceiling debate is likely to become ultra-politicized with special interest spending provisions attached to the final legislation.
This confluence of internal share price dispersion, combined with the backing up of risk aversion in the short-term credit markets, alerts us to a market condition which could lead to profound disappointment for investors.
All of our key metrics of expected market risk/return prospects are unfavorable at current market levels.
Some market commentators have projected that the SP 500 will complete the current re-pricing cycle at an index level up to 60% lower, or in the low 1000 handle. Our research doesn’t point to a level that low, but we do believe the market has scope for a 20% correction over the next three months.
As such, we strongly urge our clients and subscribers to examine all of your investment exposures, and ensure that they are consistent with your actual investment horizon and tolerance for risk.
Level 17 Chifley Tower
2 Chifley Square
Sydney, NSW 2000
1300 614 002
Investor Signals Pty Ltd
ABN 44 143 555 453