Resource Basket – Algo Signal Review
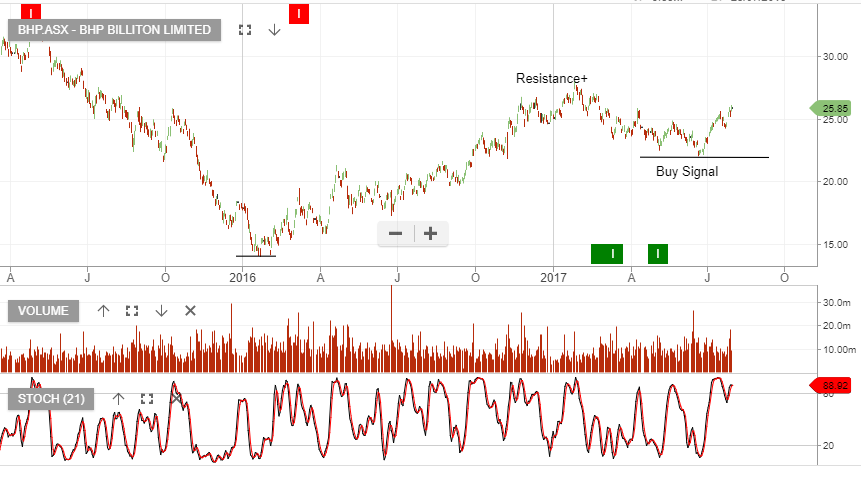
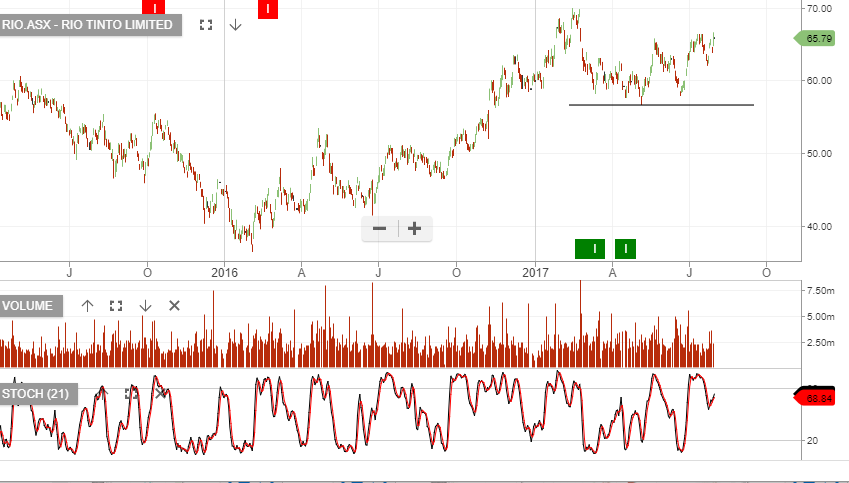
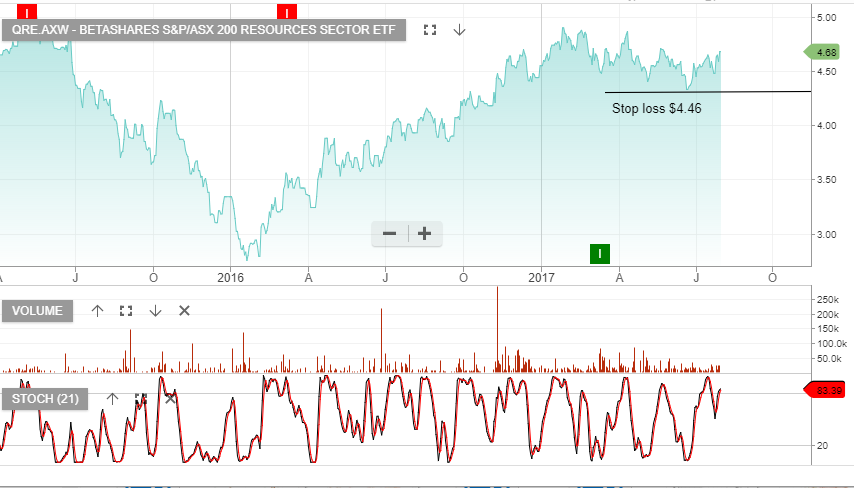
In late May our Algo Engine started flagging the “higher low” structure in large cap resource names, including a number of resource specific ETF’s.
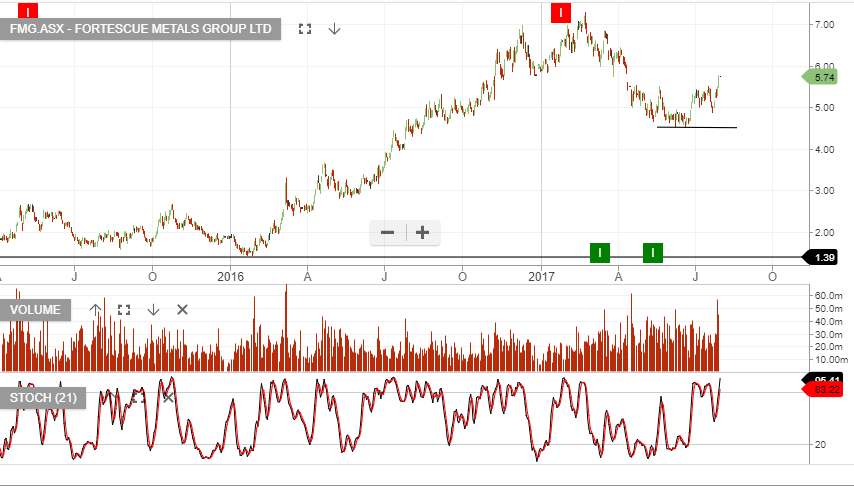
Within the ASX 100, FMG, RIO and BHP were the standout Algo Engine buy signals. In client portfolio’s we allocated towards BHP as our preferred exposure.
Over recent weeks, a rally in Iron Ore prices from US$56 per tone to US$72 per tone, has helped to accelerate the share price advance, and crude oil back at almost $50 per barrel has helped BHP.
Fund managers continue to position in BHP ahead of a potential corporate restructure, as the market speculates on the divestment of the US shale and energy assets, into a separate listed US company.
BHP reports on the 22nd August . Assuming FY17 total dividends of $1.10, BHP trades on a 4.7% yield. EPS forecasts into FY18 should remain similar to FY17 at around $1.70 per share.
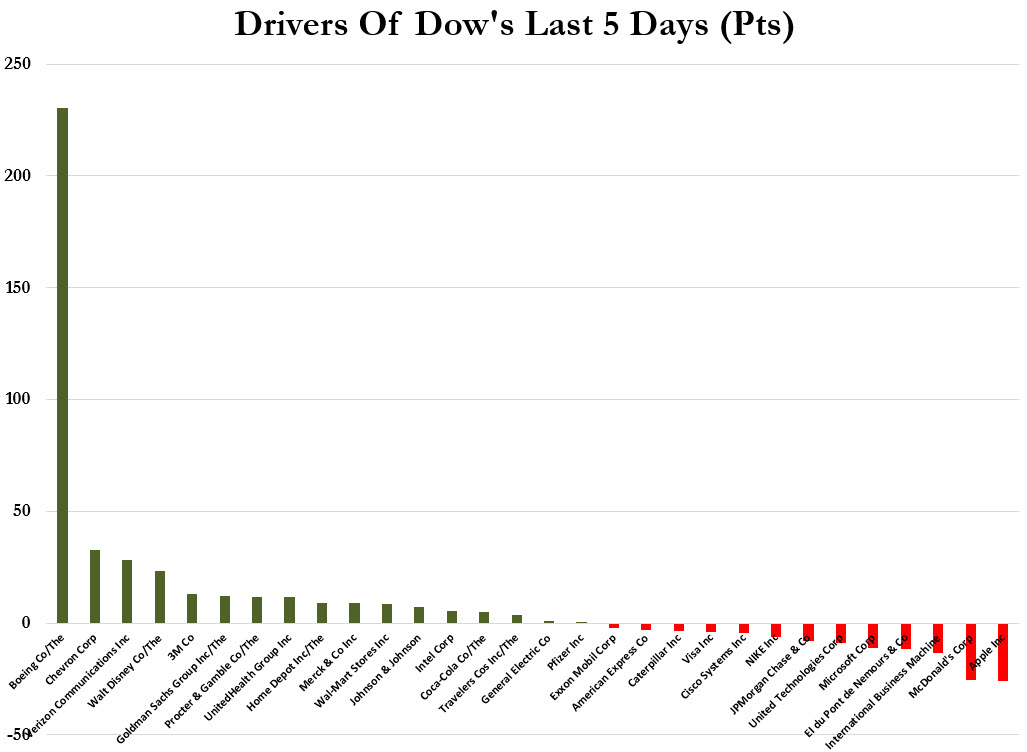
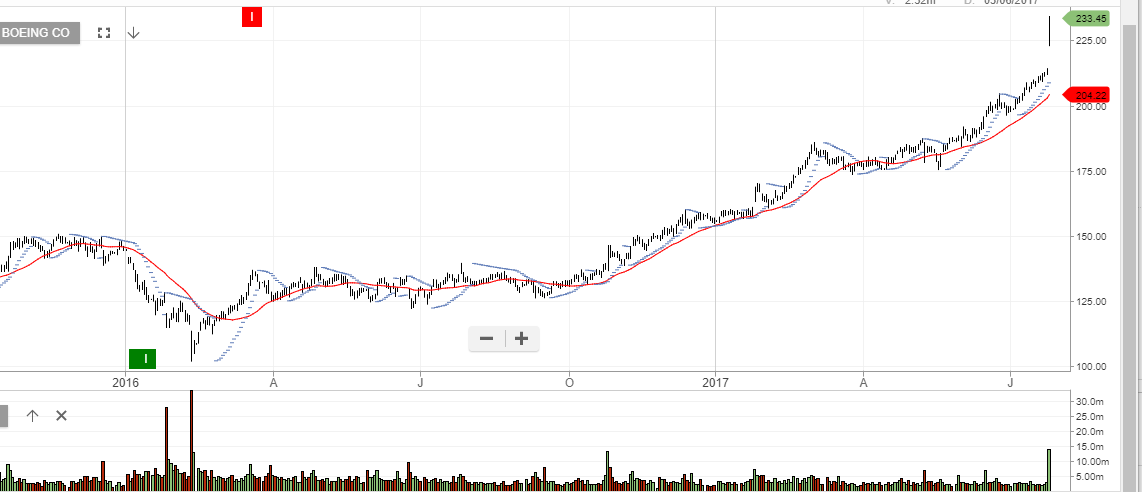
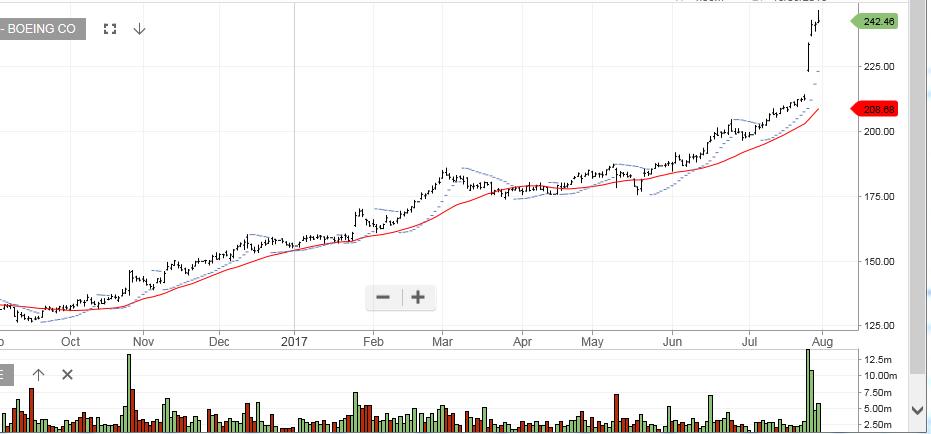 Boeing
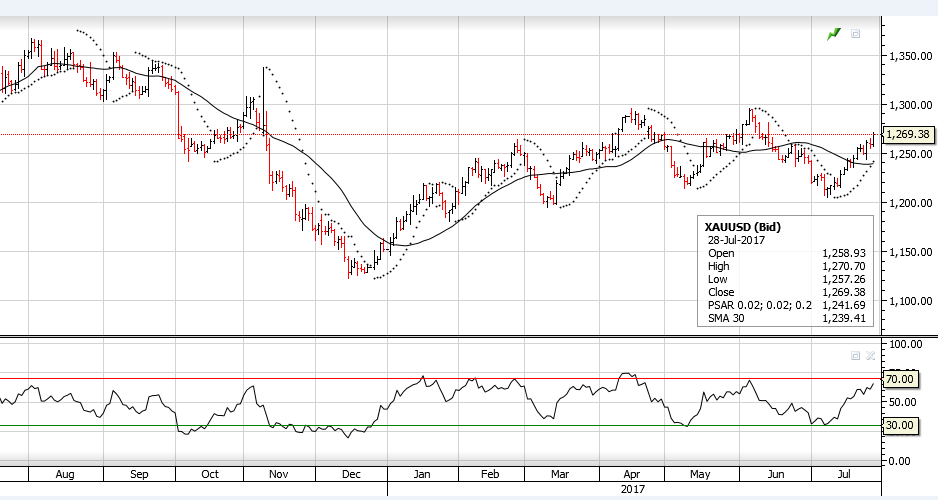 Gold
Gold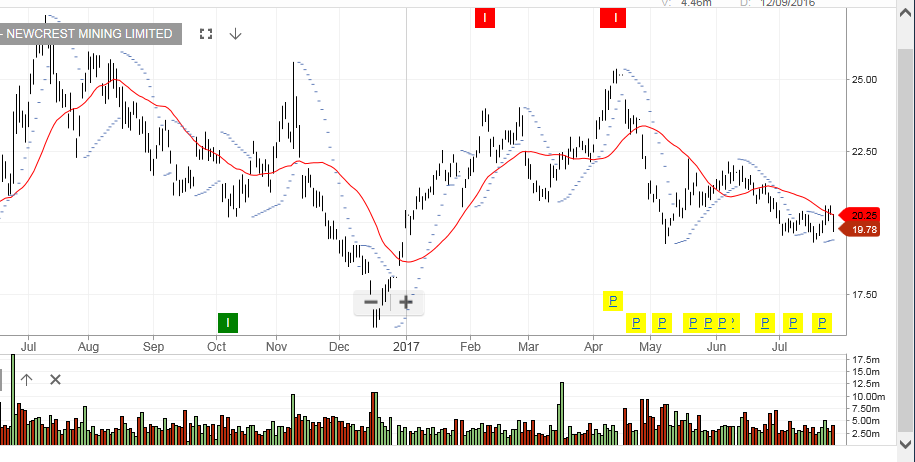 Newcrest.
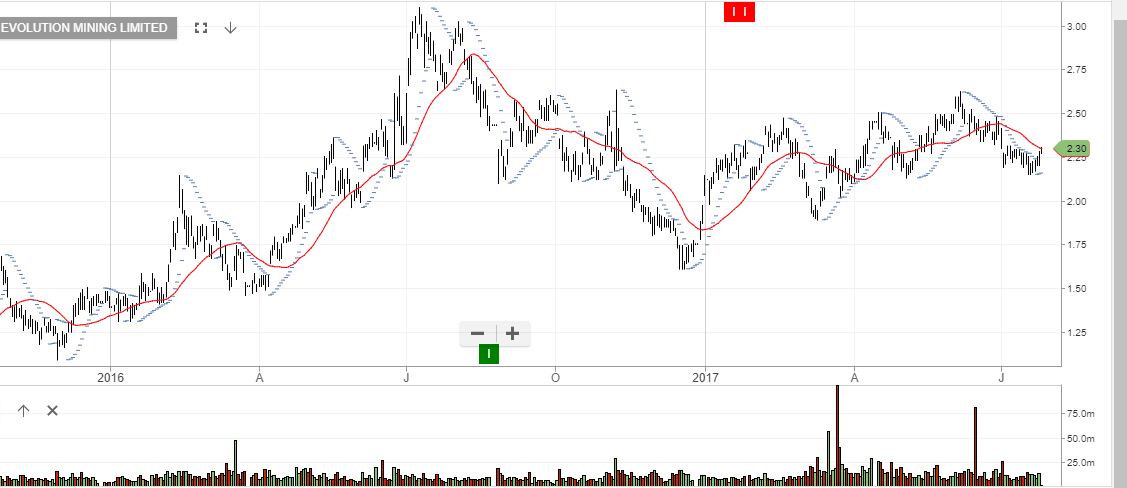
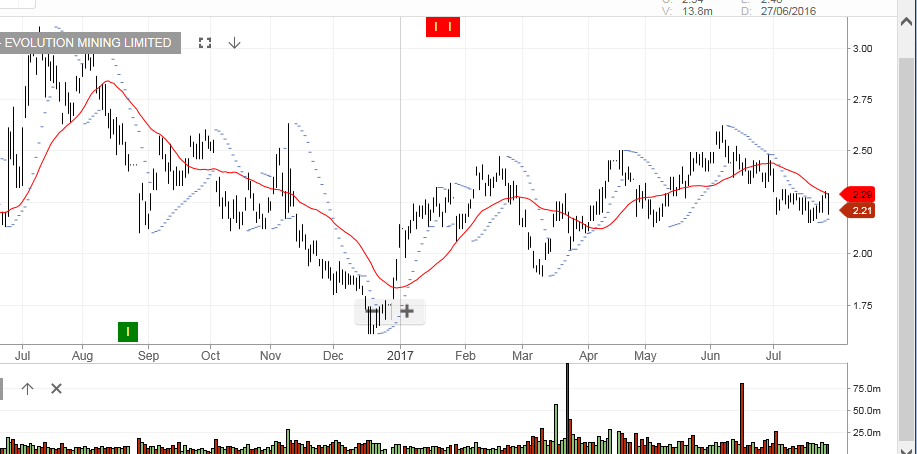 Evolution Mining
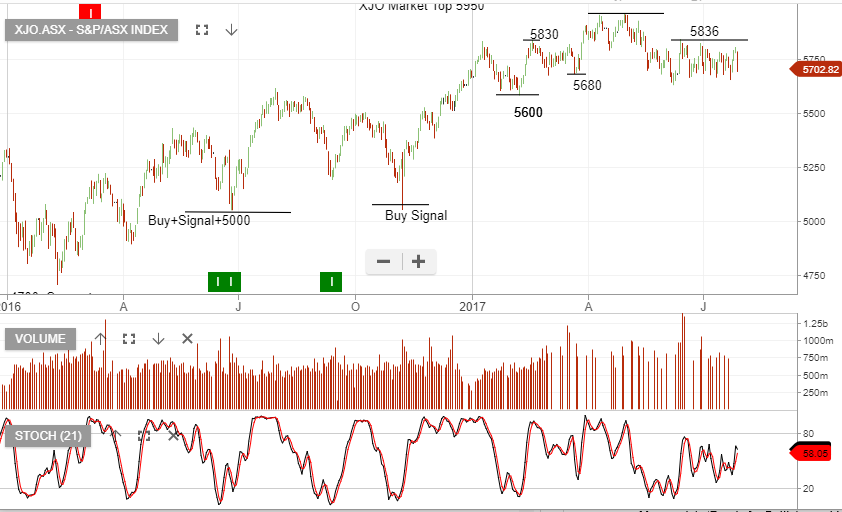
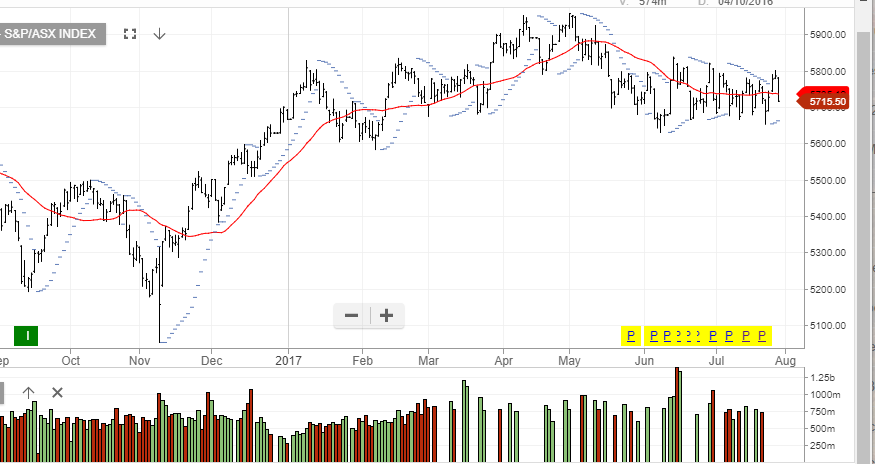 XJO
XJO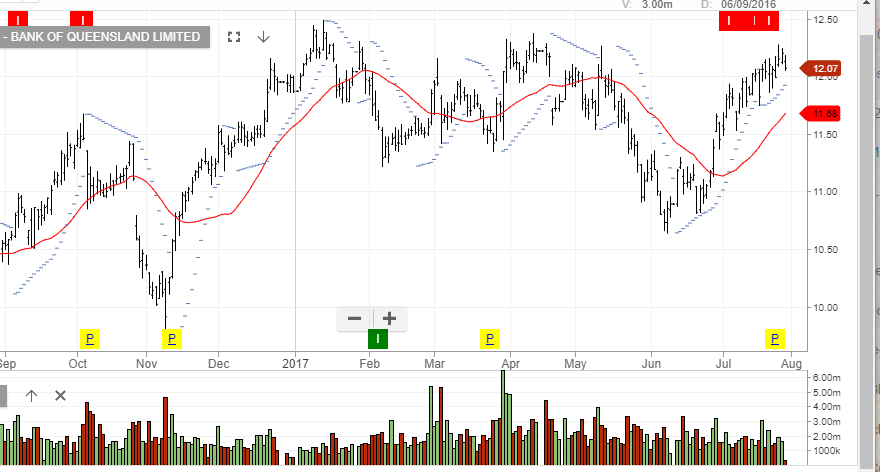 BOQ
BOQ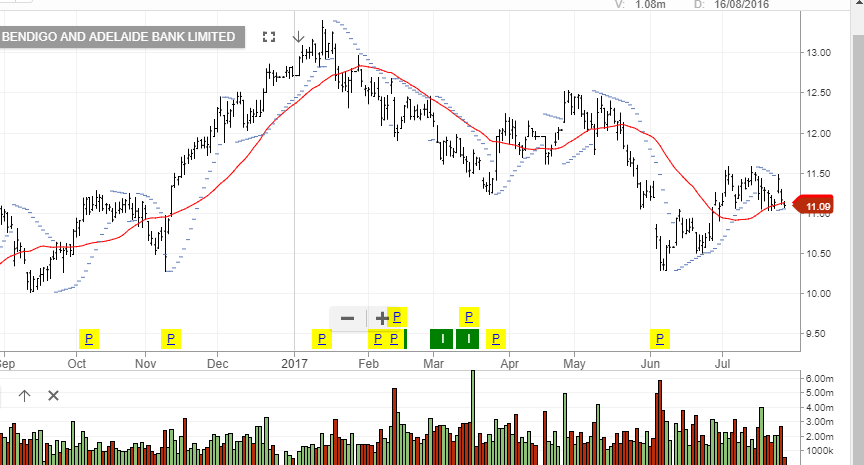 Bendigo