Chart Update – XJO

The ASX200 finished the week up 0.1%. The materials sector was up 2.7% and the the worst performer was the Property Trusts sector, down 4.9% with Stockland down 5%.

The chart below shows a further “lower high” pattern in the index. Thursday’s top at 5820 is now the third counter trend rally that has failed, since the minor downtrend started on the 1st of May, after topping at 5956.

We view 5850 as a key market level and as long as the index trades below this level, caution for downside range extension is advised.

Chart – XJO

ETF UPDATE: US Dollar Gets Steamrolled By Central Banks

In the lead-up to the long July 4th holiday, the FX market is usually pretty quiet; this was not the case this week.

In an unprecedented development on Tuesday, officials from the ECB, Bank of England, Bank of Canada and the US FED delivered speeches that outlined higher domestic interest rates and removal of stimulus sooner than the market had expected.

Since the US FED is the only central bank currently with a tightening bias, the news that other G-7  rates could all rise in unison was negative for the Greenback.

The USD Index lost over 2% for the week including a 1.6% loss to the Aussie Dollar. The AUD/USD tested the March high of .7730 before falling back to .7680 at the New York close.

The Aussie also got a lift this week as former RBA board member John Edwards expressed his view that the RBA will likely initiate eight 25-basis point rate increases over 2018 and 2019. Considering the pressure this would put on the local mortgage market, we don’t agree with Mr Edwards’ forecast.

The central bank will meet next Tuesday and we expect RBA chief Phillip Lowe to walk back on those comments and maintain the stance that any strength in the AUD/USD is a headwind to domestic growth and exports.

In the bigger picture, it’s likely that the narrowing yield differentials between US and Aussie rates will continue to favor the USD over the AUD.

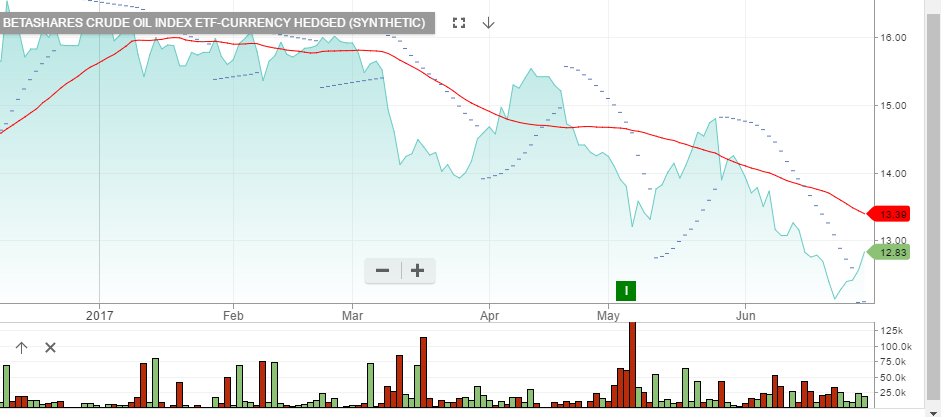
Investors looking to profit from a lower AUD/USD can look to buy the BetaShare ETF with the symbol: YANK.

YANK is an inverse ETF with a market weighting of 2.5%. This means that a 1% move in the AUD/USD will translate into a 2.5% move in the unit price of YANK.

With a current unit price of $13.85, we consider YANK to be a reasonable addition to client portfolios. We estimate that when the AUD/USD trades back to the January low of .7160, the unit price will be around the $16.50 level.
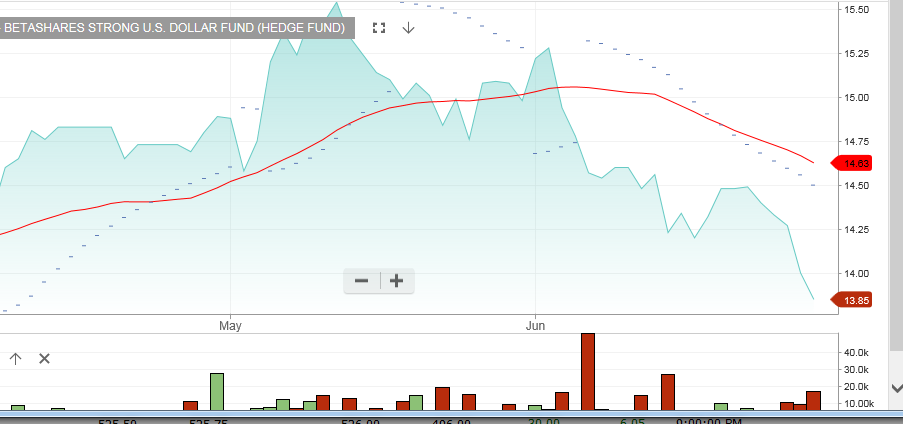
BetaShare ETF: YANK


ETF Update: OOO Is Tracking Crude Oil Higher

Prices of West Texas Intermediate (WTI) Crude Oil moved higher in New York trade, extending the recent rebound to a sixth straight session after a decline in US crude production eased concerns about deepening oversupply.

WTI futures settled up 19 cents at $44.93 per barrel after hitting a two-week high of $45.45 earlier in the day.

Supply disruptions in the Gulf of Mexico from Hurricane Cindy, as well as, increased demand for gasoline in front of the long July 4th weekend have also supported the move higher in Crude.

On June 23, we posted a report suggesting Crude Oil prices had become technically oversold and a reversion higher was likely. We are still looking for a extension of the move higher into the $46.50 area.

Investors looking to profit from higher Crude Oil prices can look to buy the BetaShare ETF with the symbol: OOO.

We started adding OOO to client portfolios in the $12.30 area.

We calculate that when WTI trades back to $46.50, the price of OOO will be near the $14.60 level, which is a reasonable area to take profits.

BetaShare ETF: OOO


US Banks Expand Share Buy-Back Plans

A week after the FED announced that 33 of 34 major US banks had passed their financial stress-tests, the banks have released their revised share buyback and dividend plans.

Analysts had estimated that positive stress-test results would open the way for banks to boost dividends and share buybacks by up to 25%, which could translate to about $30 billion back to shareholders through higher dividends and share prices.

Some of the specific plans include Citi-Group buying back up to $15 billion in shares and increasing their dividend to 32 cents per share, and JP Morgan buying back up to $19 billion in shares and lifting their dividend from 50 cents to 56 cents.

While these announcements were bullish for the share prices today, a longer-term valuation question is: How are the major US banks going to maintain these share and dividend levels?

Against a back drop of lower loan creation, thinner margins and increased bad loan provisions, we’ll track the recent price action and see if the bounce from the recent lows will be sustainable.

JP Morgan


Insurance Australia

IAG expects to see elevated reserve releases in FY17 of ~5% of NEP, and has
upgraded insurance margin guidance to 13.5-15.5%.

We think IAG is now expensive for a general insurer, trading on 18x  FY18 earnings.

Given the current tailwinds, any pullback in price will be moderate and at $6.50 the stock is well supported by a 5% dividend yield.

IAG remains an attractive buy-write.

IAG


Rotation Out Of Banking Stocks

Since Treasurer Scott Morrison announced a banking levy in the May 9th budget, banking stocks have been sold off across the board.

It’s become clear that a fair percentage of this investment flow has rotated into the local Insurance names with IAG and Suncorp both posting material gains since early May.

We hold both of these stocks in client portfolios and they are now up 12% and 8% since mid-May, respectfully.

With respect to the re-valuation in the banking shares, NAB has posted a fresh low at 29.00 in early trade today.

Both WBC and ANZ are approaching the lows posted in early June, while MQG and CBA have held up better but are still pointing lower.

On balance, we continue to expect to see rotation out of the banking names to the benefit of the insurance stocks.

IAG

Suncorp

NAB

Tabcorp – 2019 Earnings Outlook

There are encouraging trends in the core Tabcorp wagering business and the pending merger with Tatts remains an attractive investment case.

Following the Tatts merger, we look at the earnings profile of Tabcorp in 2019 and assess the forward yield and EPS growth.

We estimate Tabcorp could see EPS increase by 15% by FY19, helping to underpin a forward yield of 6%.

Chart – TAH


RIO – $3bn Share Buy-Back

RIO has confirmed that Yancoal remains the preferred bidder of Coal & Allied post a revised and improved offer from Yancoal yesterday.

We expect material free cash-flow (FCF) to be passed through to shareholders despite iron ore falling from its February peak.  In FY18, RIO could return up to $3billion  through share buy-backs.

We remain cautious on the outlook for spot iron ore prices. However, the low levels of debt, low cost of production and aggressive capital management undertaking by RIO will help to provide share price support.

FMG, RIO & BHP will likely see a minor rally from the current oversold conditions,  before turning lower.

Chart – RIO

US Update: Divergence In Market Breadth

As the SP 500 continues to trade near all-time highs, market analysts are reviewing various metrics to determine whether US Stock prices have more upside, or if they are ready for a downside correction.

One of these metrics is “Market Breadth.” Market breadth is a technique used to gauge the direction of the market by measuring the number of stocks trading higher versus the number of stocks moving lower

“Positive” breadth occurs when more stocks are moving higher than lower and vice versa for “negative” breadth.

The breadth numbers are used to determine whether the market has positive momentum or negative momentum.

The chart below shows that the SP 500 and market breadth have been diverging since late-April.

To put this divergence into perspective, as of last Friday, nearly 40% of SP 500 stocks were trading below their 200-day moving averages. In addition, 6% of the stocks listed on the NYSE hit new 52-week lows last week.

We will watch these measures closely to see if the current market pricing is resolved to the upside, or if the US Indexes commence a correction lower.

SP 500 vs Market Breadth