NYSE Internal Indicators Weaken Further

As the major US stock indexes gyrate on fundamental economic reports and political developments relating to tax reform and debt ceiling legislation, many technical indicators are reflecting the deterioration of upside price momentum.

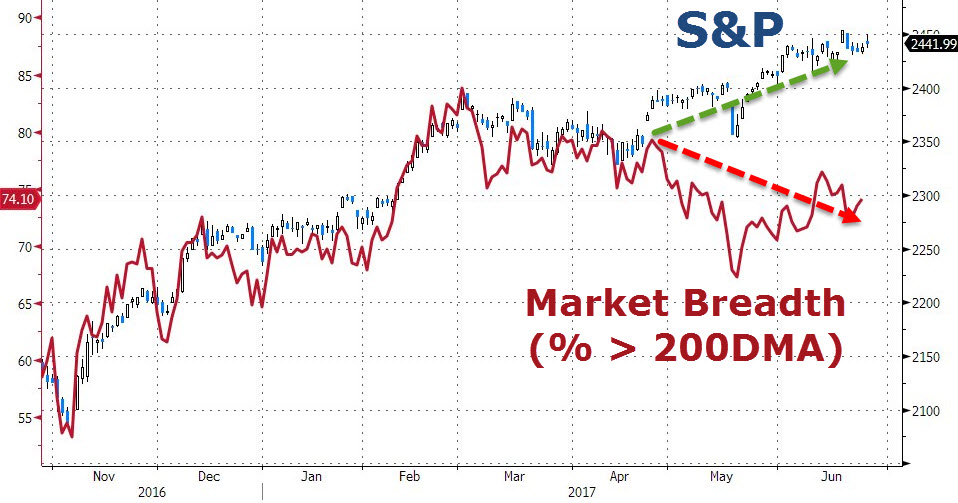
The chart below illustrates that the percentage of NYSE stocks trading above their 200-day moving average has decreased at a brisk pace over the last month.

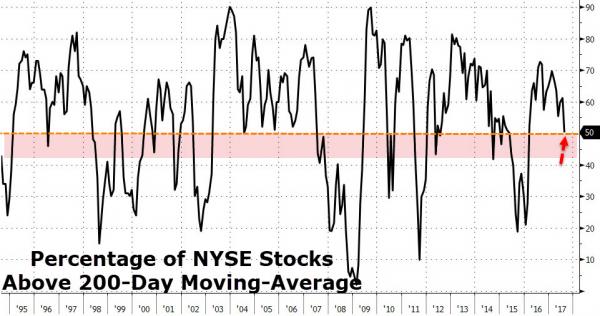
When this indicator moves below 50%, it is saying that fewer stocks are supporting the overall index price level.

Historically, this has resulted in at least a 5% correction in the SP 500 over the near-term.

On that basis, the 4-week target for the SP 500 would be in the low 2300.00 area.

NYSE Breadth


US Update: Divergence In Market Breadth

As the SP 500 continues to trade near all-time highs, market analysts are reviewing various metrics to determine whether US Stock prices have more upside, or if they are ready for a downside correction.

One of these metrics is “Market Breadth.” Market breadth is a technique used to gauge the direction of the market by measuring the number of stocks trading higher versus the number of stocks moving lower

“Positive” breadth occurs when more stocks are moving higher than lower and vice versa for “negative” breadth.

The breadth numbers are used to determine whether the market has positive momentum or negative momentum.

The chart below shows that the SP 500 and market breadth have been diverging since late-April.

To put this divergence into perspective, as of last Friday, nearly 40% of SP 500 stocks were trading below their 200-day moving averages. In addition, 6% of the stocks listed on the NYSE hit new 52-week lows last week.

We will watch these measures closely to see if the current market pricing is resolved to the upside, or if the US Indexes commence a correction lower.

SP 500 vs Market Breadth