ALGO Update: Buy Signal In AMP

Our ALGO engine triggered a buy signal in AMP at $5.06 going into yesterday’s ASX close.

Since posting a tepid earnings report on August 10th, AMP shares have dropped from $5.45 down to yesterday’s low of $5.05.

The ALGO picked up on the “higher low” pattern since the initial support at $5.00 held and the recent low at $4.90 was not challenged.

Taking into account the earnings report showed revenue up 25% to $7.6 billion, and the interim dividend was lifted 4% to 14.5 cents, we see scope for some capital appreciation in the AMP from these levels.

Investors should look at placing a stop-loss order just under the June 9th low of $4.90.

AMP


Ansell – FY17 Earnings

FY17 results for ANN were mixed with revenue growth of 2- 3 %. Cash conversion was strong and lower capex supported the dividend.

With this report, it’s difficult to draw any clear comparisons to past results as added expenses and divestment of businesses segments renders historical divisional comparison meaningless.

We view FY18 guidance as conservative and see the 3% forward yield as an attractive risk reward proposition.

A streamlined operation and moderating raw material costs should see Ansell’s share price trade higher over the next 12 -24 months.

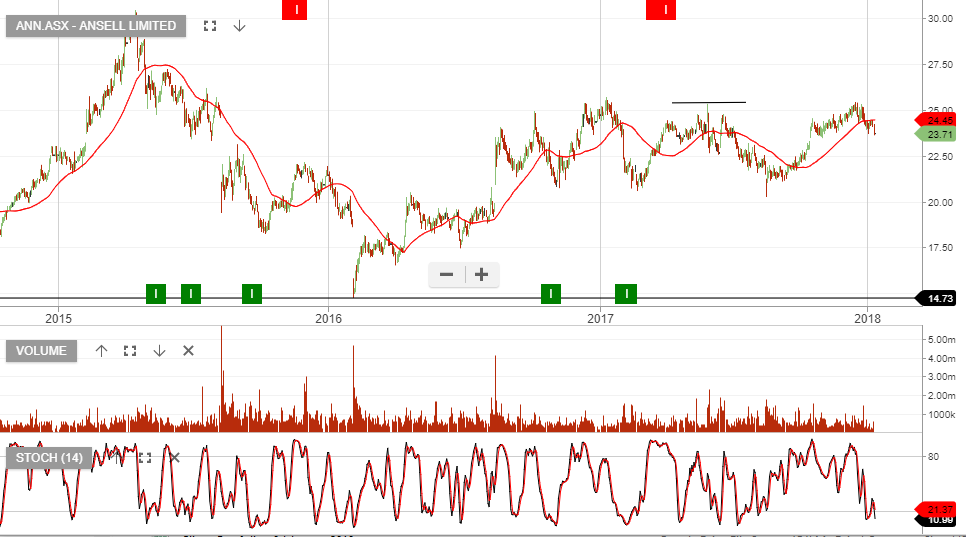
Chart – ANN


Bendigo Bank – FY17 Earnings.

Bendigo Bank delivered a solid FY17 cash profit of $418 million,  which was in-line with consensus.  Improving margin trends and dividend growth helped push the shares of BEN higher in yesterday’s trading.

We feel the regional banks will struggle in the next 12 to 24 months with flat earnings, higher costs and increasing debt debt provisioning.

Assuming flat earnings and dividend growth into FY18, we have BEN trading on a 6% forward yield.

Chart – BEN


Aurizon Holdings – FY17 Earnings

AZJ reported its FY17 EBIT of $836m and guided towards  FY18 EBIT growth of 8 – 11% or $900 – 960m.

Losses in both Intermodal and bulk divisions were higher than market expectations. Dividends were reduced to $0.225 for the year but this was offset by the company announcing a $300 million share buy back.

We feel FY18 EPS growth may be optimistic and the reduced dividend is something we’ve been flagging as a potential concern coming into this result.

Assuming dividends remain flat over the next 12 months, it places AZJ on a forward yield of 4.4%.

Chart – AZJ


Newcrest Mining Profits Jump 22%

Australia’s biggest gold miner, Newcrest Mining, has recorded a full year underlying profit of $394 million, a 22 per cent jump on the previous year.

The strong rise in profit still missed analysts expectations of around $434 million, which has seen the share price slip to $21.65 in early trade.

The company will pay a final dividend of US7.5 cents per share (70 per cent franked) – for a full year dividend of US15 cents.

Further, NCM outlined a new policy under which the company’s dividend payout would be at least 10-30 per cent of that financial year’s free cash flow.

In a statement to the ASX, Newcrest said that under the new policy, the dividend would be “no less than US 15 cents per share on a full year basis”.

Newcrest said its healthy profit came from gold production of 2.38 million ounces, at a “Group All-In Sustaining Cost” of $787 per ounce.

The gold producer recorded free cash flow of $739 million, and reduced net debt by 29 per cent to $1.5 billion.

We maintain an upside bias to NCM and look for rising Spot Gold prices to lift the share price into the $22.60 area over the near-term.

Newcrest Mining


Black Monday 2011, Revisited

Just over  six years ago, August the 2nd 2011 to be exact, the US Congress avoided a Sovereign default and finally reached an agreement to raise the US debt ceiling from $14.29 trillion to  $15.77 trillion.

The legislation was called the “Budget Control Act of 2011”, and was signed on the same day by President Barack Obama.

During the negotiations, credit agencies, Moody’s, Fitch and Standard and Poor’s all advised lawmakers that the US AAA credit rating was going to be reviewed regardless of the debt ceiling legislation.

After the market closed on Friday, August 5th, several rating agencies downgraded the US credit rating to AA+ .

This triggered a massive selloff on Monday, August 8th,  where The NASDAQ Composite Index fell 174.72 points (-6.90%), the SP 500 Index shed 79.92 points (-6.66%), and the Dow Jones 30 Index lost 634.76 points (-5.55%).

The aggregate loss on the day was over $1 trillion.

As the chart below illustrates, the fall out from the 2011 debt ceiling crisis led to the SP 500 losing 208 points, or 16.1% in just 6 trading days.

The US Congress and the White House have already commenced discussions about raising the debt limit from the current level of $19.80 trillion, with a September 29th deadline.

Considering the market’s inflated valuations based on tax cuts and infrastructure spending, domestic issues with consumer credit and autos loans, and the escalation of geopolitical risks, we suggest caution that this time the US equity market sell off could be much greater.


SP 500 August 2011.


Chart Update – Dow Jones Index

The chart below of the Dow Jones Index illustrates the selling pressure that is now building, in what has to be viewed as an overpriced market, relative to the risks which lie ahead.

The short-term momentum indicators have turned negative and we remain cautious on banks, property developers, consumer discretionary & companies that are trading on bubble level PE ratios.

Chart – Dow Jones
Chart – Dow Jones