fbpx

Chart Update – Dow Jones Index

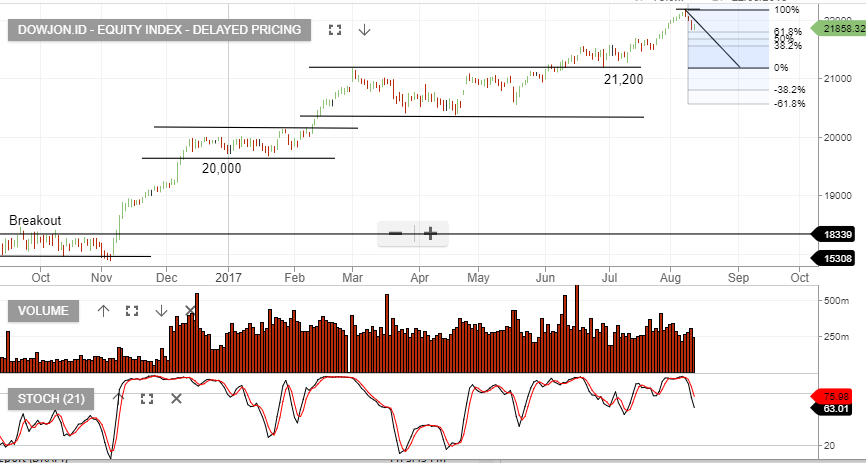
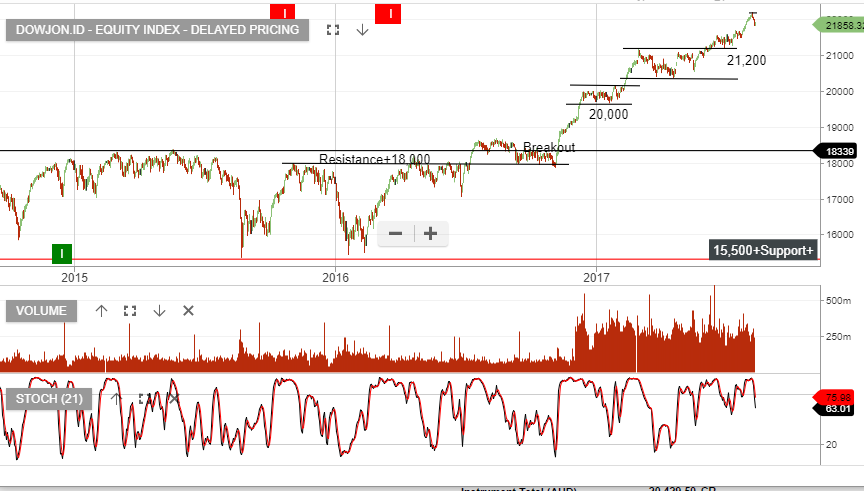
The chart below of the Dow Jones Index illustrates the selling pressure that is now building, in what has to be viewed as an overpriced market, relative to the risks which lie ahead.

The short-term momentum indicators have turned negative and we remain cautious on banks, property developers, consumer discretionary & companies that are trading on bubble level PE ratios.
You're not a member!  Trial today

Chart – Dow Jones
Chart – Dow Jones


Leave a Reply

Investor Signals Pty Ltd ABN 44 143 555 453 is a Corporate Authorised Representative CAR No. 439411 of Advisor Plus Pty Ltd AFSL 474520
© 2024 Investor Signals

Send our ASX Research to your Inbox

Or start a free thirty day trial for our full service, which includes our ASX Research.