Resmed – 4Q17 Earnings

Global mask sales were  weaker than expectations, but we see F18 device  and mask growth rebounding.

FY18 revenue is forecast to grow by  of 5%+ and underlying EPS growth in the high single digits.

RMD is trading at 24x F18 EPS and we see the current sell-off as a buying opportunity

We need to give this name a wide range to find support and the buying zone is between $8.50 and $9.25. 1, 2 & 3 years out, the stock will be trading at higher prices. Keep an eye out for the next Algo buy signal in RMD!

Chart – RMD


RIO – 1H17 Earnings

RIO reported 1H17 underlying earnings of US$3.9bn, which was largely in line with market  expectations. EBITDA of US$9.0bn was also in line.

Lower capex resulted in cash flow and net debt coming in slightly better than exceptions (gearing now 13%)  with net debt end of June US$7.6bn. 

Buy-back was boosted by US$1.0bn increase, helping to offset a softer interim dividend. The interim dividend announced was US$1.10 and assumes 50% payout ratio.

In 2018 we expect RIO to see flat earnings growth at best, and we have the stock trading  on a forward yield of 4.5%.

Chart – RIO


US Credit Card Defaults On The Rise

US media reports suggest the US economy is flashing a warning sign that could mean US is headed for a downturn.

Credit card companies are starting to grow nervous as the net charge-off rate, or the percentage of loans that credit card issuers write off as a loss, has just hit its highest level in four years, a continuation of several quarters of the rate rising.

The trend hit all major card issuers and is starting to eat into bank earnings. The current rate is 3.29%, but it is still a long way from the peak hit in 2010 of 10%.

The rate had dropped for 24 straight quarters during the recovery, until a reversal in recent quarters.

The “cause and effect” logic is that once credit card defaults begin to rise, the default rate on mortgages also begins to rise, which is a much bigger problem for the US economy.

Credit Card Default Rate  


Woolworths – Algo Update

We’ve been long Woolworths following the recent Algo Engine buy signal.

Through adding a $28 December covered call option we’ve boosted the annualized cashflow to 10 – 12%, which includes capturing the $0.58 September dividend.

WOW reports on the 23rd August. The stock is trading on 20x FY18 earnings and 3.3% forward yield.

FY17 EPS is likely to around $1.50 per share and the market is forecasting underlying EPS growth into FY18 of 8 %, to $1.65 per share.

Chart – WOW


Resource Basket – Algo Signal Review

In late May our Algo Engine started flagging the “higher low” structure in large cap resource names, including a number of resource specific ETF’s.

Within the ASX 100, FMG, RIO and BHP were the standout Algo Engine buy signals. In client portfolio’s we allocated towards BHP as our preferred exposure.

Over recent weeks, a rally in Iron Ore prices from US$56 per tone to US$72 per tone, has helped to accelerate the share price advance, and crude oil back at almost $50 per barrel has helped BHP.

Fund managers continue to position in BHP ahead of a potential corporate restructure, as the market speculates on the divestment of the US shale and energy assets, into a  separate listed US company.

BHP reports on the 22nd August .  Assuming FY17 total dividends of $1.10, BHP trades on a 4.7% yield. EPS forecasts into FY18 should remain similar to FY17 at around $1.70 per share.

Chart – BHP
Chart – RIO
Chart – FMG
Chart – QRE


Algo Buy Signal – Amcor

Our Algo Engine triggered a buy signal on Amcor as the stock forms a “higher low” pattern at or near $15.30.

Amcor reports earnings on the 22nd August, the market in looking for EPS growth of 8 – 10%.  The recent rally in the AUD may see forward guidance reduced slightly, if the AUD was to stay above $0.80.

We continue to like Amcor as a buy and hold portfolio position, complimented with a covered call option. We’re allowing moderate capital growth and when combining the dividend with the covered call option, we’re generate 10 – 12% annualised cashflow.

Chart – AMC


Boeing Lifts The Dow In July

The Dow Jones 30 Index posted its 5th consecutive new record high close today at 21,891.

During the month of July, the Index gained 570 points, or 2.6%.

As the chart below illustrates, 310 of those 570 Dow points were generated by one stock: Boeing.

Boeing shares climbed over 24% during the month of July from $197.75 to $246.00. In just the last 5 trading sessions, Boeing shares rose 16% from $212.50 to $246.00.

Since the Dow is a price-weighted Index, a higher point value, or Beta, is assigned to higher priced stocks.

Boeing

A Busy Data Week In Australian Markets

The AUD/USD reached a 2.5 year high of .8065 last week.

Comments from RBA chief, Philip Lowe, that the central bank is not compelled to follow the USA’s higher interest rate policy only had a temporary effect on the Aussie.

This week’s data calendar has several potentially market moving reports.

The RBA is not expected to adjust interest rates on Tuesday.  However, if the board re-affirms their neutral-to-easing bias, the AUD/USD could retreat from recent highs.

Wednesday’s building approval data is usually a second-tier report but will be closely watched this month.

Thursday’s trade balance numbers are expected to remain in surplus, but the $1.77 billion consensus number is half of last month’s amount. This release would not have included the recent rally in the AUD, which would have a dampening effect on exports.

Friday’s Retail Sales data will have more impact on ASX stocks than the AUD. The forecast is an increase of .2%, which will keep the yearly sales pace barely in positive territory.

On balance, we expect the RBA and trade balance numbers to weigh on the AUD/USD,  and potentially turn the trend back to the downside.

Investors looking to profit from the AUD/USD trading lower can look to buy the BetaShare ETF with the symbol: YANK.

YANK is an inverse ETF, which means the unit price increases as the price of the AUD/USD decreases. YANK also has a 2.5% weighting, which means a 1% change in the AUD/USD will correspond to a 2.5% move in the unit price.

The current price of YANK is $12.60. We calculate that when the AUD/USD trades back to the January low near .7300, the unit price will trade at $16.75.

BetaShare ETF: YANK

Gold Continues To Climb

Gold posted a low of $1204.50 on July 10th. Since then, the yellow metal has rallied over 5% and hit an intra-day high of $1270.70 in last night’s New York trade.

This marks the 3rd straight week of higher prices and internal momentum indicators are now pointing to the June high of $1295.75.

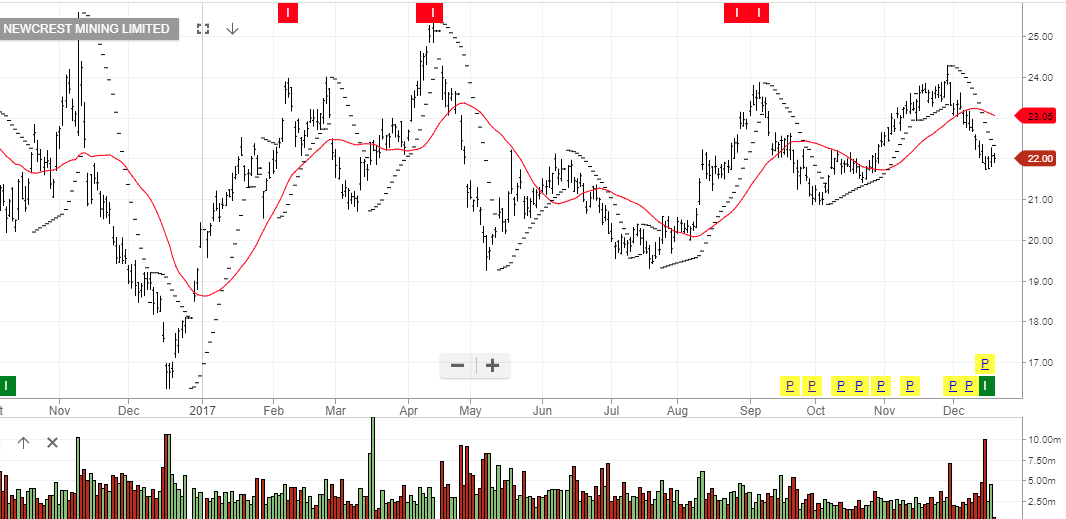
However, share prices of local gold miners NCM and EVN have not reflected this stronger trade in the spot Gold price.

Both NCM and EVN announced positive quarterly production numbers last week, and we expect both names will break out their recent ranges on the topside.

Over the medium-term, we have price targets of $22.10 for NCM and $2.60 for EVN.Gold

Newcrest.

Evolution Mining