Sonic and Ramsey – Value has Emerged
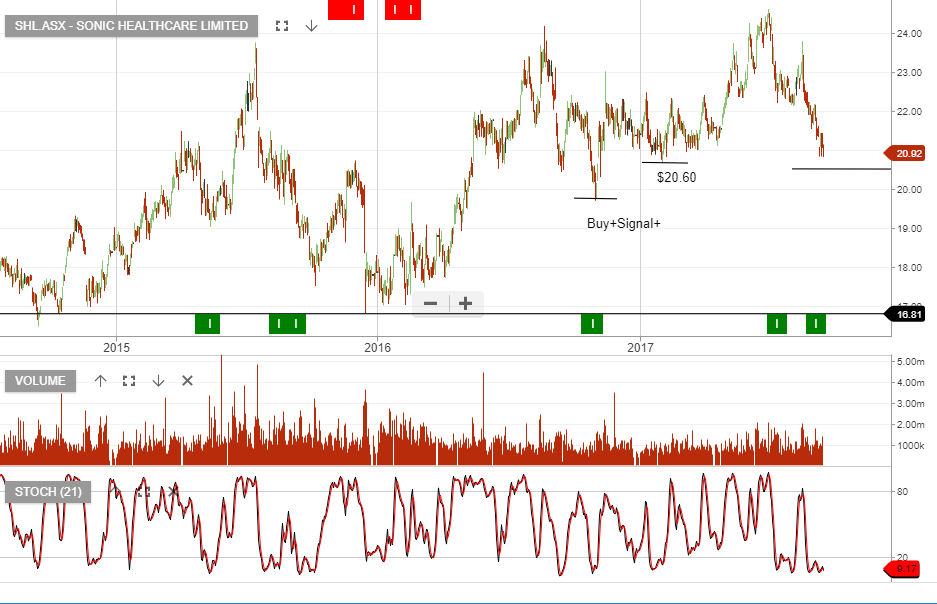
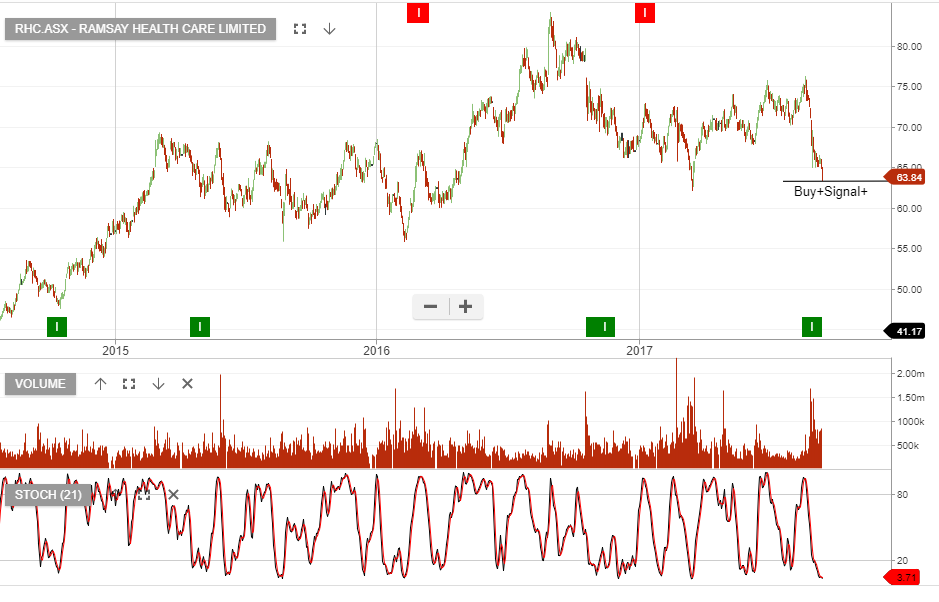
We feel both Sonic and Ramsey Healthcare are now reaching oversold price levels.
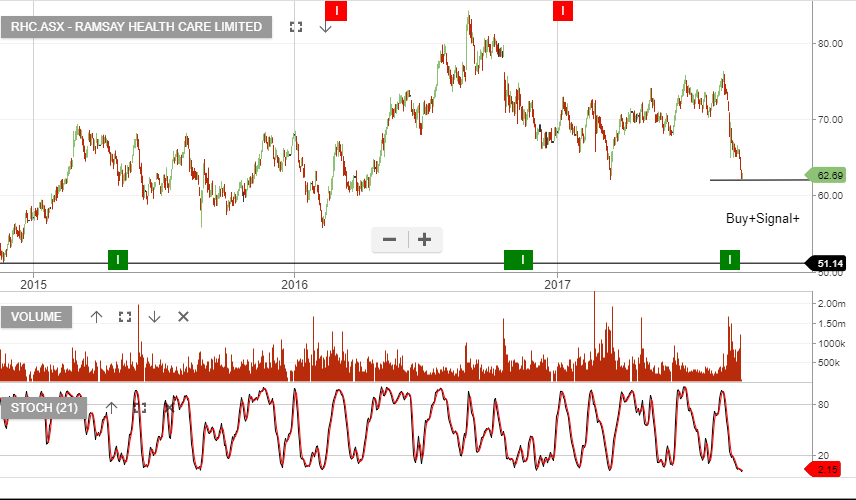
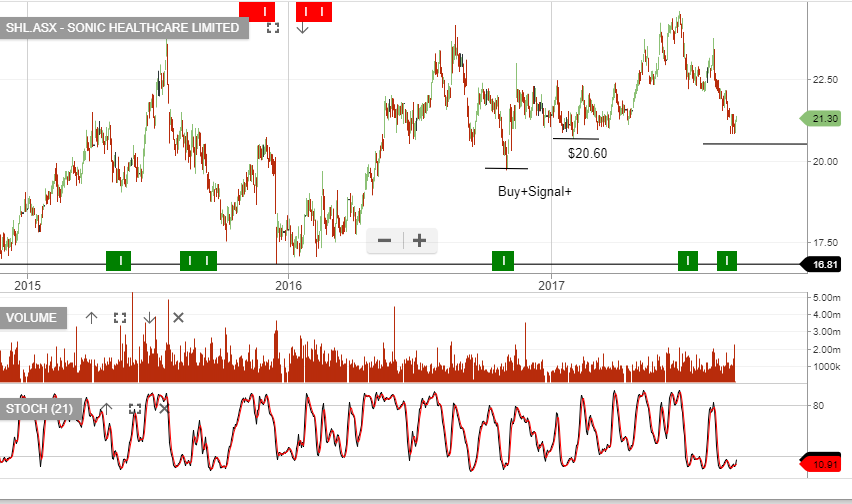
We feel both Sonic and Ramsey Healthcare are now reaching oversold price levels.
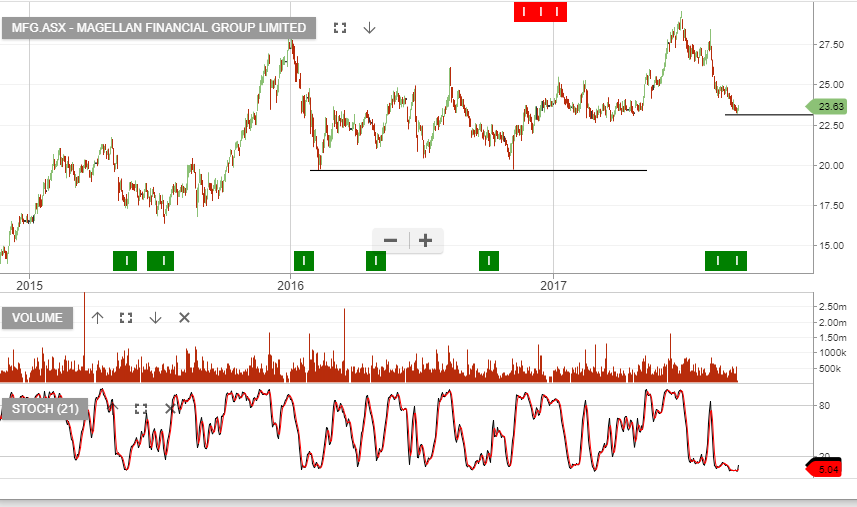
Our Algo Engine has flagged the higher low structure in MFG, BTT, SUN and MQG.
Traders may want to take a closer look at these names and place sell stops below the low formed in the past few trading sessions.
This coming Tuesday and Wednesday, the FOMC will meet to discuss the next move in US monetary policy.
Over the last several months, it’s been well-telegraphed that this meeting will focus on unwinding QE and shrinking their balance sheet. The amounts and the mechanics have already been announced. Now it’s just a matter of announcing a starting date.
US financial markets have been brushing off the Fed and have done the opposite of what the Fed has set out to accomplish.
The Fed wants to tighten US financial conditions. It’s worried about asset prices and that these inflated assets, which are used as collateral by the banks, pose a danger to financial stability.
The FED has mentioned several inflated asset classes by name, including equity prices and commercial real estate, which backs $4 trillion in loans heavily concentrated at regional banks.
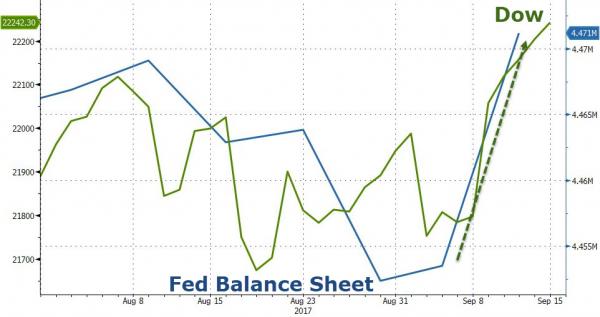
The FED has raised rates four times since December 2015, including three times over the past nine months. As the chart below illustrates, the relationship between the DOW Jones Index and the FED’s balance sheet is highly correlated.
As such, the FED’s decision could be a prime driver of US equities next week.
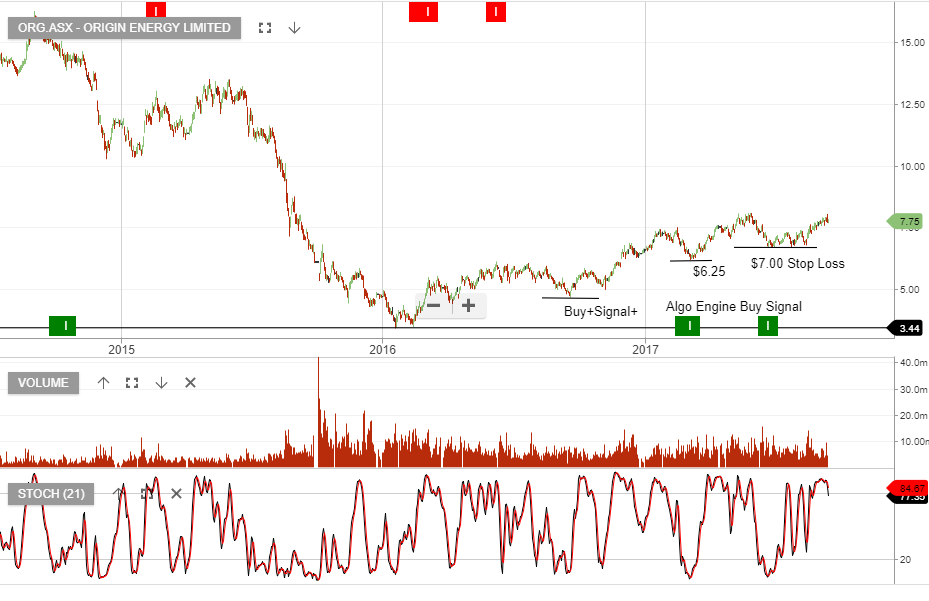
Our Algo Engine has triggered recent buy signals in SHL and RHC, we feel both of these names are now trading into an oversold price range and buying support will soon develop.
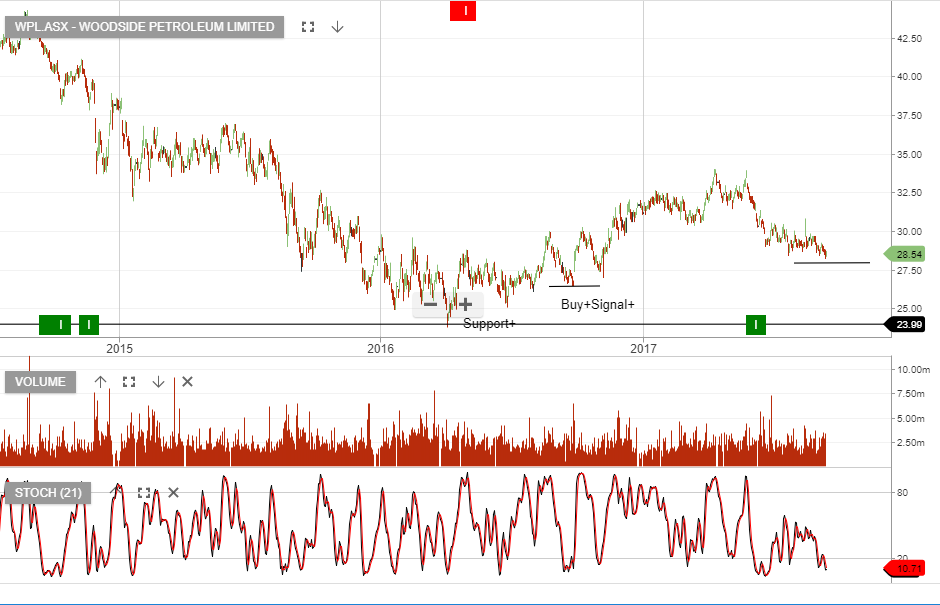
We’re now watching the price structure in energy related names as we feel Iran’s ambitions in the Middle East may develop into a flash-point to greater confrontation.
The standoff between Qatar and the rest of the Gulf Cooperation Council continues and should a conflict involving Iran occur, the risk to crude oil supply is significant.
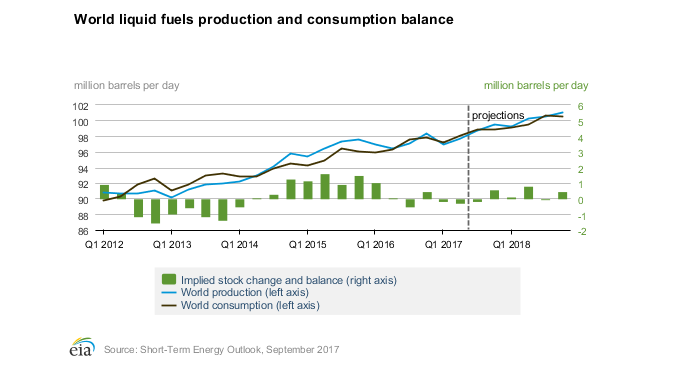
If there is a disruption of crude oil from Iran and Iraq, the oil market goes from balanced, which it is now, to a shortfall in supply.
The graph below illustrates the potential for demand to begin outpacing current production.
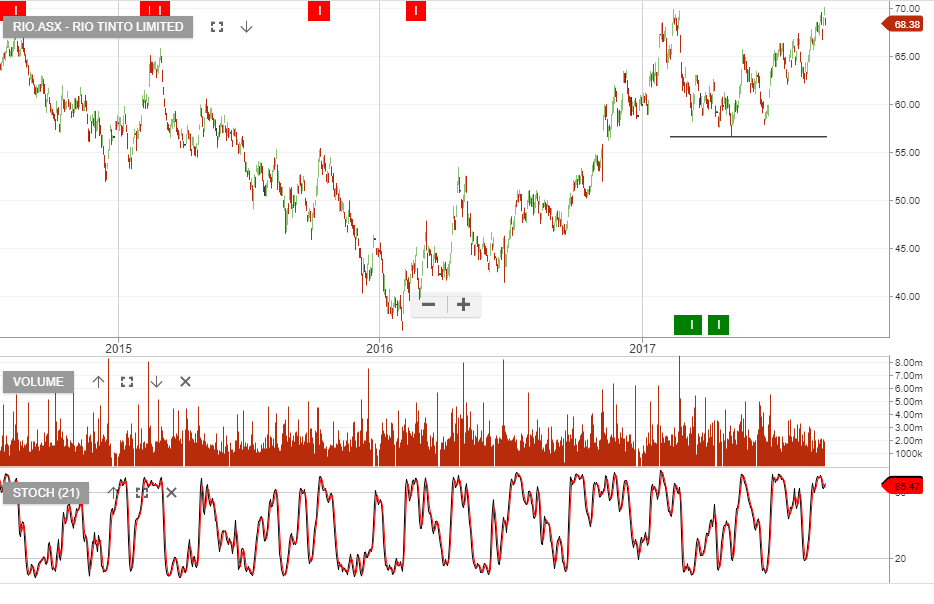
RIO is likely to free up additional capital through the proceeds from the complete exit of coal and high cost aluminium smelting.
We estimate that this could raise more than $7.5 billion, potentially more than doubling shareholder cash returns in FY19
Recent sentiment around iron-ore and aluminium have helped drive RIO’s share price. We consider RIO near the top end of the valuation range.
However the share price should remain well supported, and when complimented with a covered call, we’re delivering 12% annualised cash flow.
FY 18 EBIT forecast of $9.8 billion, EPS $4.50 and DPS $2.45, places the stock on a forward yield of 4%.
Rio Tinto
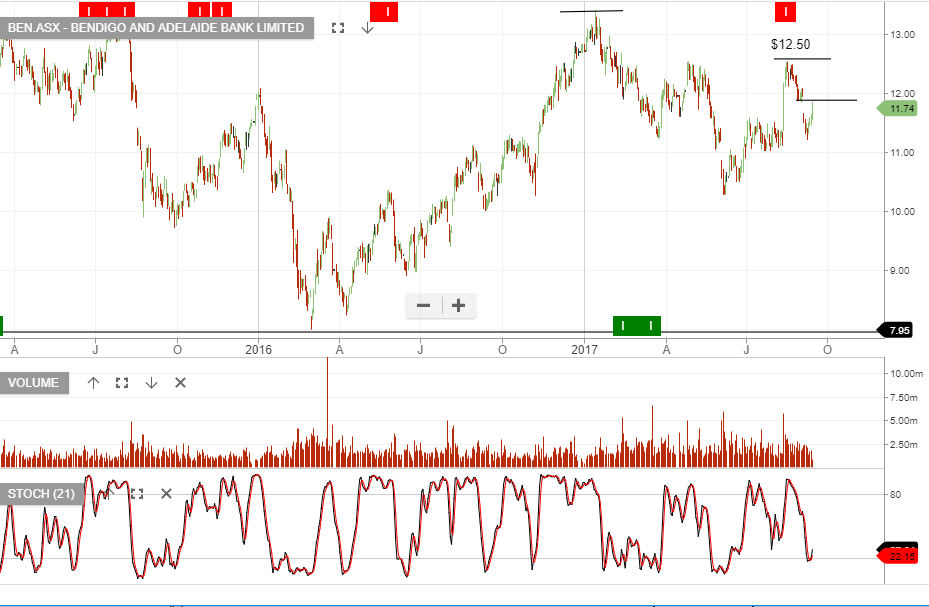
On the 16th of August our Algo Engine triggered a sell signal in BEN at $12.50.
The current price action is a counter-trend bounce within a protracted downtrend.
The $11.75 area provides another opportunity to consider the short side of Bendigo Bank.
BEN
The AUD/USD posted a 2.5-year high of .8125 on September 8th. On that day, the US 10-year bond yields had dipped to a six-month low of 2.03%
Since then, the 10-year yields have climbed higher and reached 2.19% in NY trade today. The AUD/USD has traded lower overnight and is testing support at .7980; a break of this level will give scope to the .7910 area.
There are many components of forex pricing but yield differentials will always have the biggest impact.
As such, if today’s domestic employment report posts lower than forecast, we expect to see more downside in the AUD/USD.
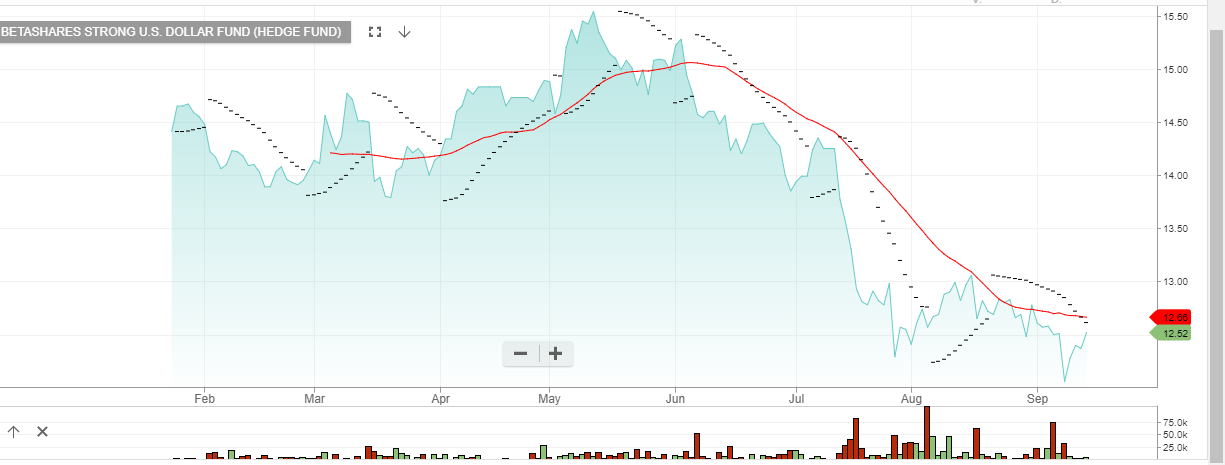
Investors looking to profit from a lower AUD/USD can buy the BetaShare ETF with the symbol: YANK.
YANK is an inverse ETF, which means the price of YANK increases as the AUD/USD trades lower. It also has a weighting of 2.5%, which means the unit price will fluctuate by 2.5% for every 1% change in the AUD/USD exchange rate.
With a current price of $12.60, we calculate that the price of YANK will be near $16.50 as the AUD/USD returns to the January low of .7160.
BetaShare ETF: YANK
Since posting a low of $1204.00 on July 10th, Gold has rallied over $150.00 to hit an intra-day high of $1358.00 on September 8th.
Geopolitical tensions, Political uncertainty, weather events and volatile global equity markets have all been drivers of the Gold price over the last three months.
And while these events are still very present in the market, changes in their impact can be difficult to forecast.
Shares of Newcrest hit an intra-day high of $23.85 on September 6th. Since then we’ve seen over a $1.50 pullback to $22.10.
Ideally, we would like to see NCM shares at or around the $21.90 area to re-establish long positions on a scale-in basis.

Newcrest Mining
Keep Woolworths on your radar as we’re likely to see an exhaustion to the current selling pressure and a bounce higher.

Woolworths

Level 17 Chifley Tower
2 Chifley Square
Sydney, NSW 2000
1300 614 002
Investor Signals Pty Ltd
ABN 44 143 555 453