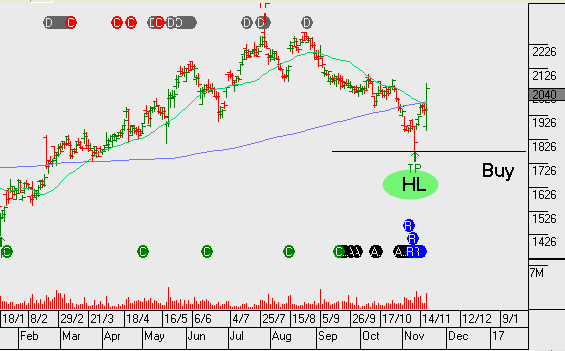
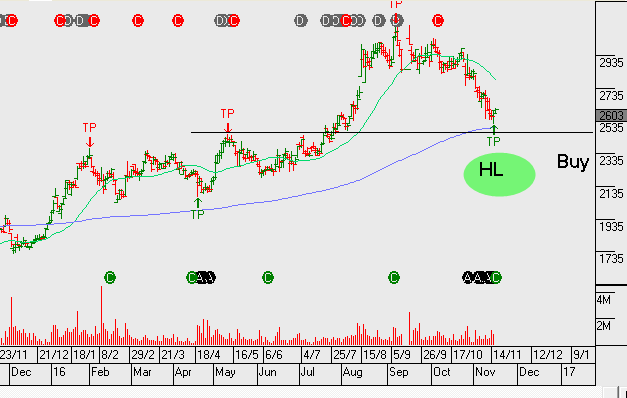
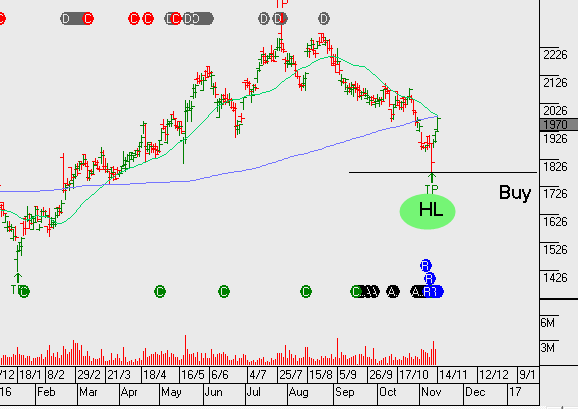
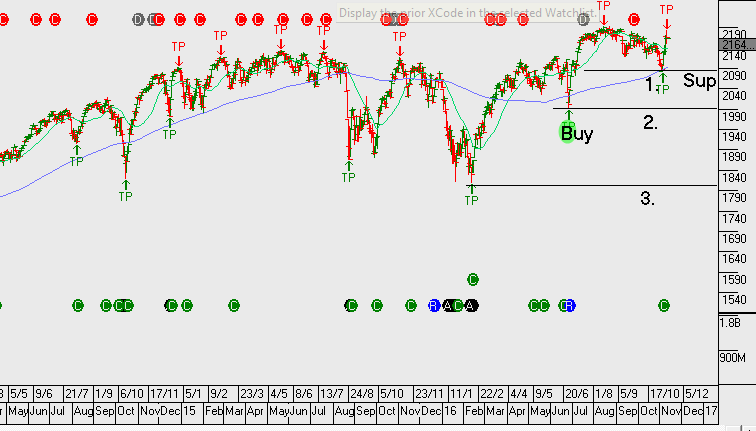
James Hardie half year (ended 30 September 2016) earnings show net operating profit of US$141m, an increase of 10% on the same time last year. Group Adjusted EBIT for the half US$204 million, also up 10% on last year.
The James Hardie earnings update supports our view that JHX remains well positioned to benefit from the ongoing recovery in US housing construction.
Overnight, US housing Starts data was released. On an annualised basis, October data showed 1.3m in October compared to expectations of 1.1m. Building Permits annualised 1.23 in October compared to expectations for 1.2m
FY17 revenue US$2b, EBITDA US$470m, EPS US$0.60 and DPS $0.44, placing the stock on a forward yield of 3%. We expect EPS growth of 10%+ in to FY17 and FY18.
Our algorithm engines triggered a buy signal earlier this week.
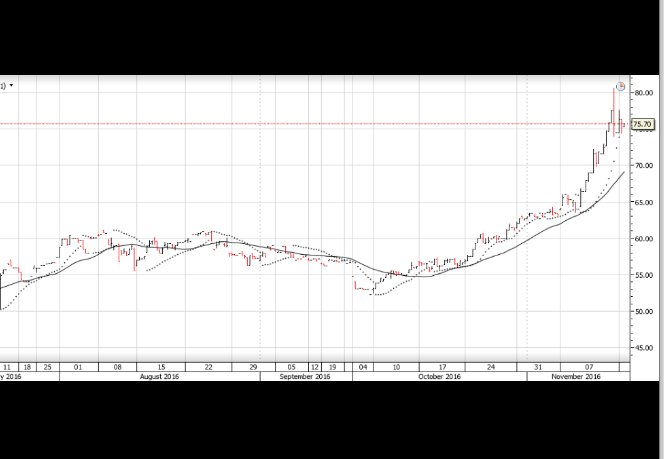
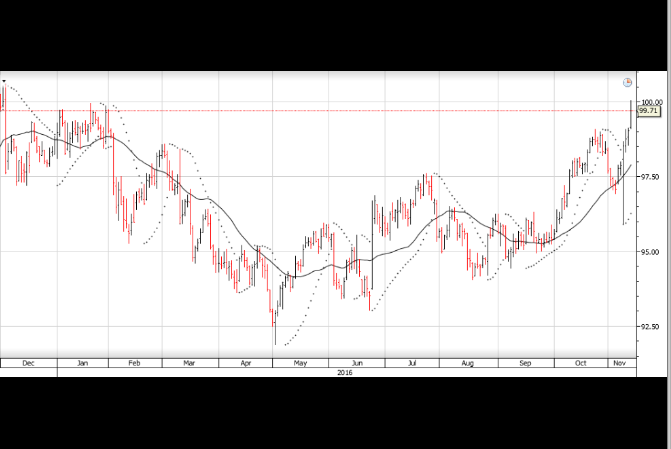
Oil prices surged overnight as investors speculate that OPEC members will push toward securing a deal to cut output. West Texas Intermediate Crude oil rose 5.8%.
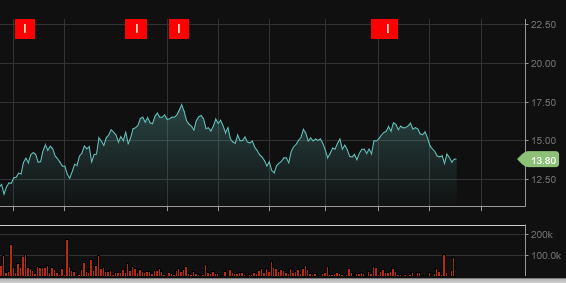
As an introduction to our ETF Watch commentary, we’re looking at the BetaShares Oil ETF listed on the ASX under the code OOO.AXW. The ETF provides investors with a “pure play” to take a view on oil prices. It aims to track the performance of an index (before fees and expenses), that provides exposure directly to crude oil futures.
In addition, as oil is priced in USD the fund hedges its USD exposure back to AUD, which reduces currency risk for Australian investors.
At a company specific level, we continue to like OSH, ORG and note the recent positive momentum in STO following China’s Hony Capital increasing its share holding.
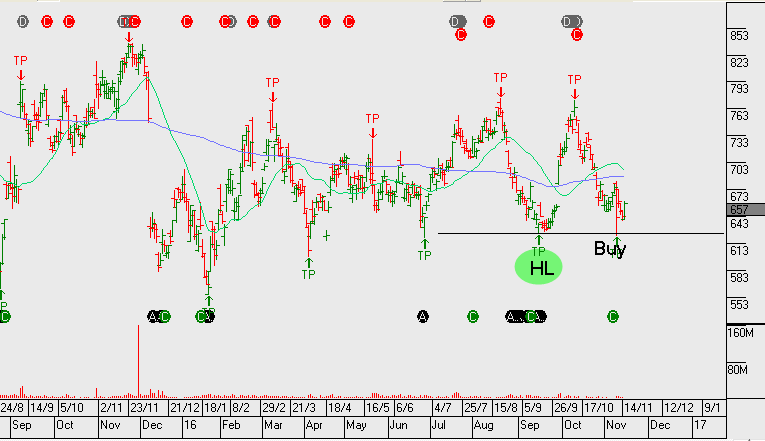
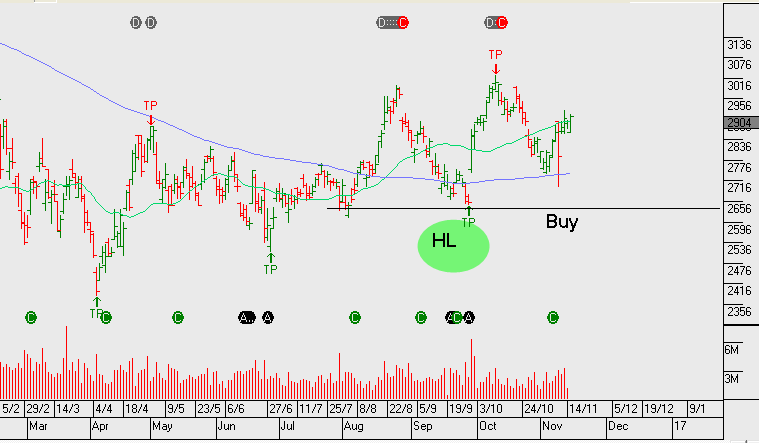
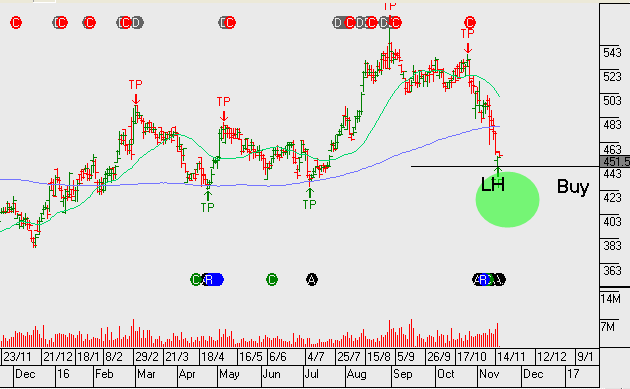
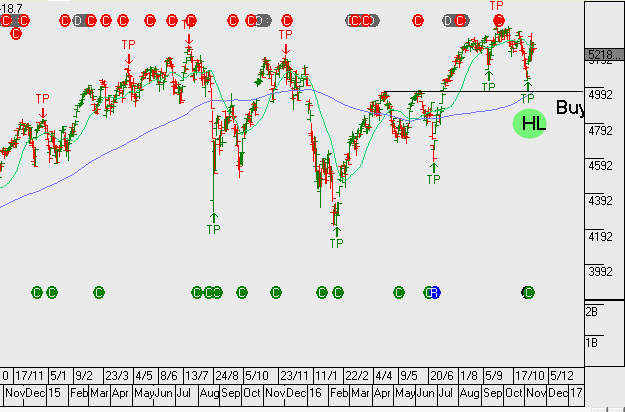
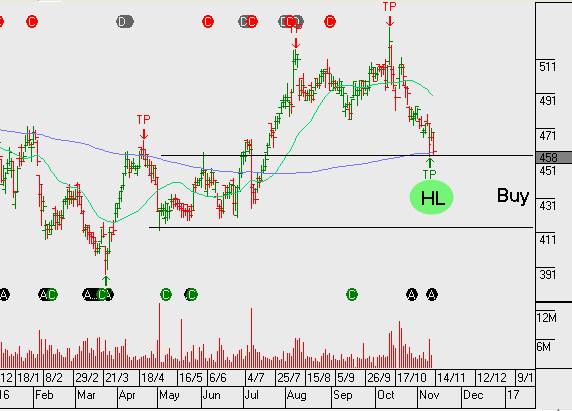
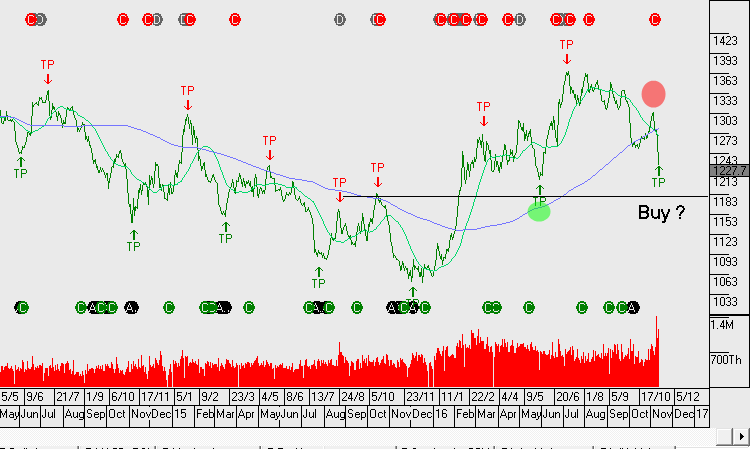
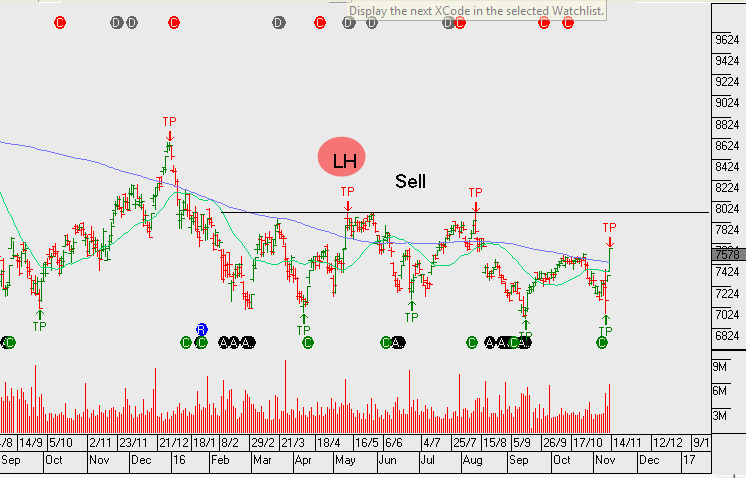
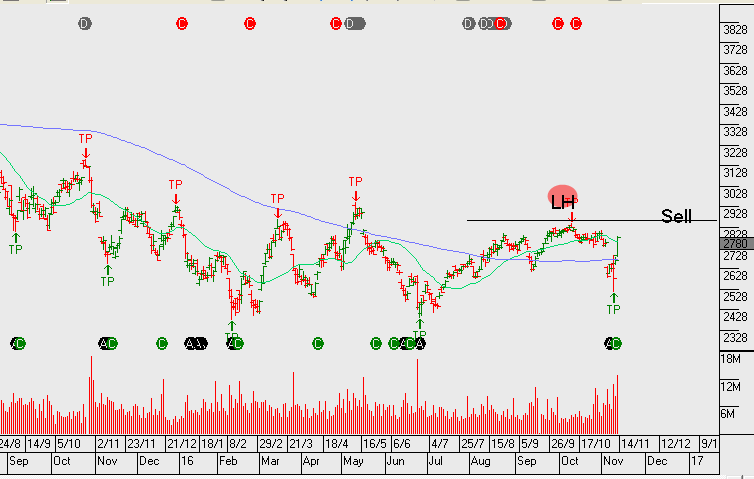
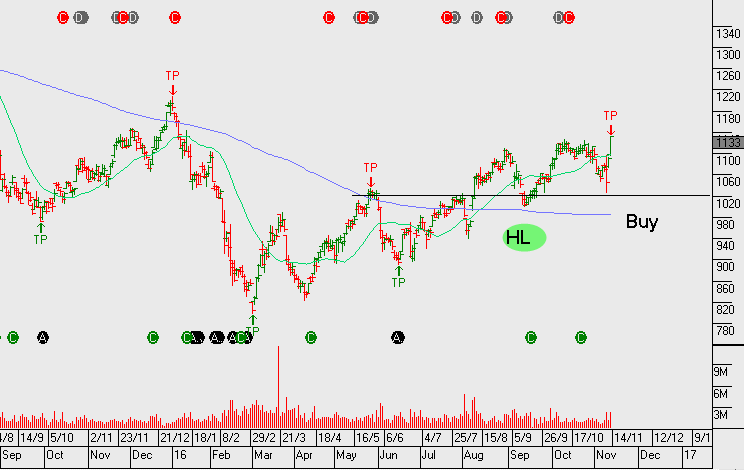
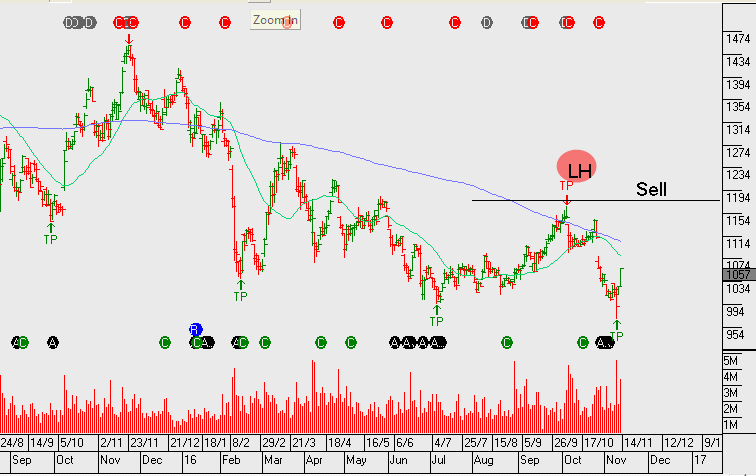
Harvey Norman and JB Hi-Fi have sold off recently and now reflect at a “higher low” price formation within a broader uptrend. Our algo engine has triggered buy signals on both of these names, so we will take this opportunity to look a little closer.
Harvey Norman reported a solid Q1FY17 trading update, yet the share price has sold off over 15% following questions being raised over the group’s accrual accounting practises. The strong history of free cash flow generation should begin to dampen investor concerns and lift share prices.
FY17 revenue is likely to be up 7% year-on-year to $1.9b, EBITDA $650m and NPAT $375 which will be up 10% on FY16, placing HVN on a forward yield of 7%.
Momentum studies suggest HVN is worthy of consideration: FY15 to FY16 EPS growing by 25% or from $0.24 to $0.30 per share.
The USD has been a major beneficiary of the final result of the US Presidential election. Not only has US Dollar sentiment improved now that no protracted legal challenge will create market uncertainty, but it’s also getting a lift from the direction of current policy measures outlined by the FED and President-elect Donald Trump.
Long time readers will recall that our bullish case for the USD has been based on the theme of diverging monetary policy between the FED and the other G-7 central banks. However, now that Mr Trump is discussing some details about his economic plans, investors are now anticipating favorable fiscal policy measures which are bullish for US Stocks and the USD, as well.
During the Presidential campaign, both Trump and Clinton promised fiscal stimulus , but Trump’s plan offers more infrastructure spending and tax cuts and could top the $1 trillion mark (or 6% of GDP) by the time it’s fully implemented. At the same time, investors are growing more confident of a FED rate hike next month and the futures markets are beginning to price in a more aggressive FED. On the Friday before the election, market participants learned that US average hourly earnings rose by 2.8% on a year-on-year basis. This is the fastest pace in five years and consistent with rising core inflation pressures.
This policy mix of tighter monetary policy and expanding fiscal policy is the most bullish combination for a currency. The last time the US economy saw this this concurrent policy dynamic was after the 1980 election when the Reagan/Volcker mix sparked a 30% US Dollar rally into 1985; which was the impetus for the Plaza Accord. With little first tier Economic data scheduled in the US, we expect to see the firm tone in the USD and US asset prices continue this week.
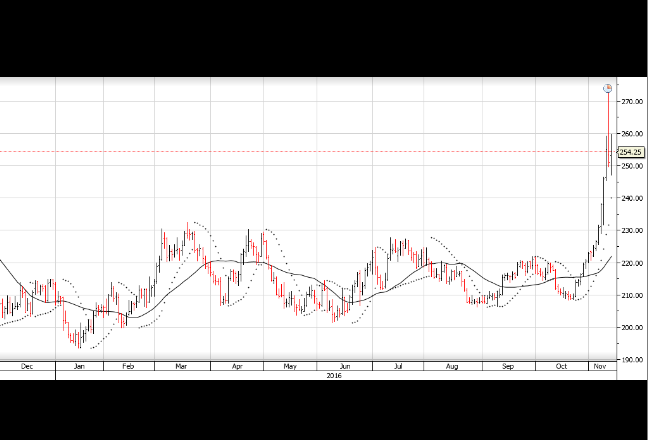
Since the Global Financial Crisis in 2008, one of the most consistently followed market correlations has been …. how the value of the US Dollar influences the price of base metals and industrial minerals including Coal, Copper and Iron Ore.
Over the last eight years, from a basic “cause and effect” standpoint, as the US Dollar appreciated against the basket of G-7 currencies, the price of Coal, Copper and Iron Ore declined; and vice versa.
However, over the last 45 days, this correlation has soften materially. During this period, the price of Comex Copper has rallied from $2.10 per pound to $2.60 per pound; a gain of over 23%. Similarly, over the same timeframe, the price of Iron Ore has risen from $63.00 per ton to $76.00 per ton for a 20% gain, and the price of Coal has lifted over 11% from $41.00 per ton to $45.50 per ton.
This has all occurred while the USD Index has traded just over 4% higher from 95.50 to 99.50.
We recently highlighted James Hardie as a buy recommendation and we therefore draw your attention to the upcoming 2Q earnings result scheduled for release on Thursday.
Consensus expectation for FY17 net profit is around US$275m. This will mean JHX is delivering 15%+ EPS growth. It’s likely that a positive earnings trend can be supported by stronger demand for its products from North American consumers.
FY17 revenue $2b, EBIT $400m, NPAT $275, EPS $0.65, DPS $0.44 places the stock on a forward yield of 3%
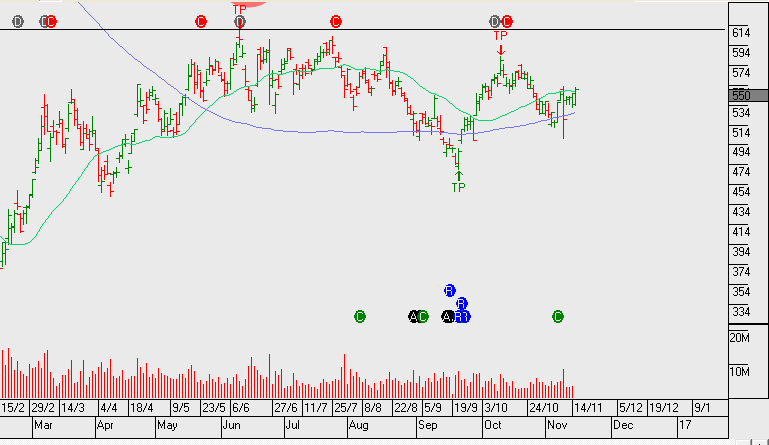
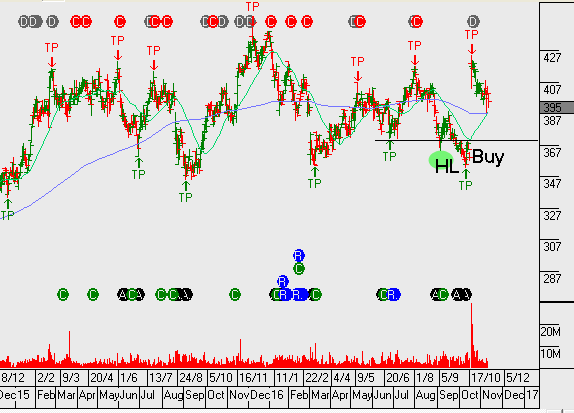
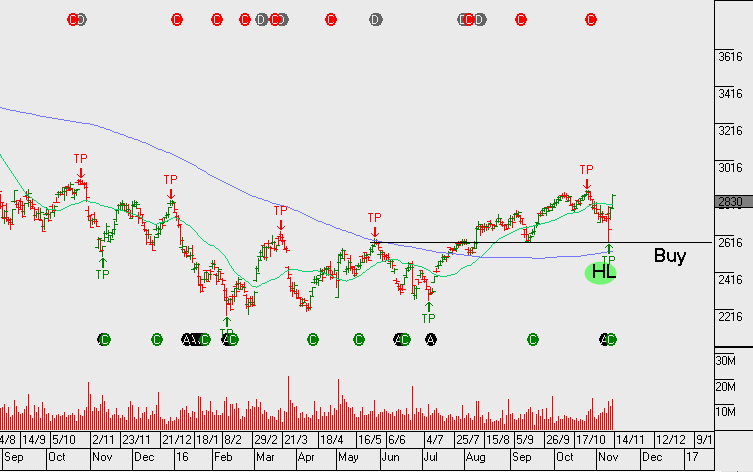
Strong competition is likely to subdue 1H17 earrings growth for TABCORP.
The 5% sell-off the stock has had over the last two weeks sees TAH trading back into our value range and the stock is now producing a buy signal from our algorithm engine.
The announced merger on the 19th of October between TABCORP and Tatts Group along with the $500m share buyback, should help to underpin the share price.
FY17 revenue $2.2b, EBITDA of $550m, EPS of $0.24 places the stock on a forward yield of 5.5.
Following Mr Trump winning the election and Mrs Clinton accepting the result, bedlam broke out in the financial markets midway through the Asian timeframe: the USD was sold off across the board, Gold rallied $60.00 to $1,335.00, the SP 500 fell limit down to 2030, bond yields plunged 15 basis points and the Mexican Peso made a new all-time low at 20.75.
However, just as the London dealers were rolling up their sleeves, calculating potential margin calls and preparing for a financial blood bath, the market dynamic changed. The catalyst of the market stabilization and subsequent rally appears to be two-fold: 1) Mrs Clinton called Mr Trump to concede defeat (which meant no chance of a protracted legal challenge) and 2) the market started pricing in the reflationary aspects of some of Mr Trumps campaign promises.
The cornerstone of his general economic plan has been the initiation of a massive infrastructure package. However, the market was caught off-guard by the announcement that part of the package would be funded by a tax concession to US corporations holding US Dollars off shore.
It’s estimated that up to $2.9 Trillion of corporate profits are being held off-shore by US companies unwilling to take the 35% profit tax charge to repatriate the money. These multi-national companies include General Electric, Apple, Microsoft and Intel……all of which have more than $100 billion parked overseas.
As the news of this proposed tax reform/amnesty plan circulated through the market, infrastructure names, heavy construction companies and stocks of military defence contractors all rallied higher. Whether or not this grand plan ever makes its way into the US economy will be determined on another day.
But as the US market heads into the three-day Veteran’s Day holiday, the USD Index is back over 98.50, US 10-yr yields are over 2.15% and the SP 500 is poised for its strongest weekly gain in over two years.
Next week the market will focus on data from the EU and Japan, but for now, global risk assets are satisfied that the transition of Presidential power will transfer smoothly and that Mr Trump is going focus on the economy first.
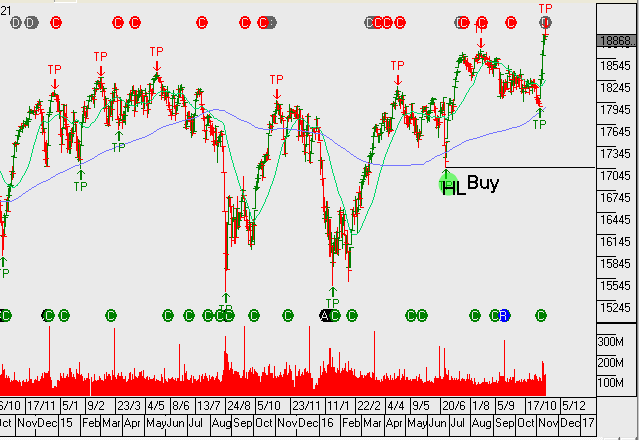
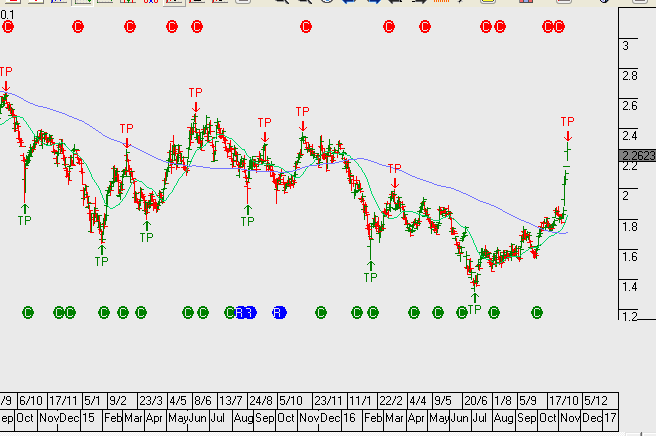
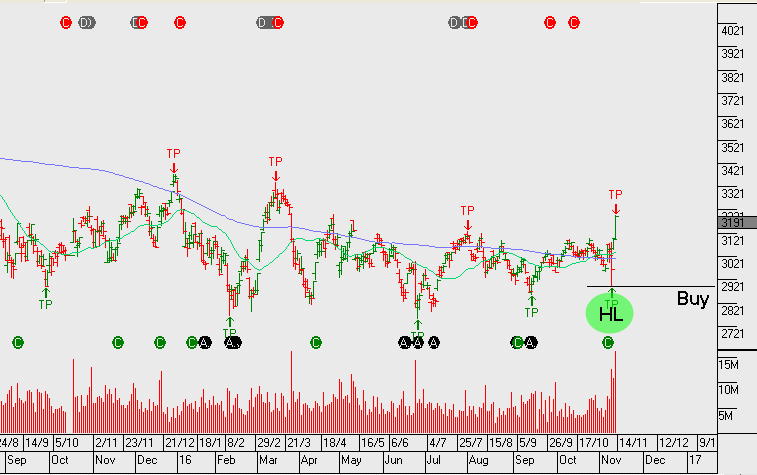
We now have ANZ and WBC creating a higher low formation. However, CBA and NAB still remain below the recent highs within the downtrend that’s been in place since May 2015.
Back in August, ANZ was the first to break the downtrend and now WBC has followed. Within the regional banks, between BOQ and BEN, it’s Bendigo that’s displaying a more bullish price pattern.
Although the breakout in financials is strong at present, we don’t see too much further upside. As reflected in the recent earnings results, the banks are having difficulties growing top line revenue. Our largest bank exposure in client portfolios is Westpac. We’ve left this name uncovered at present, however, it’s likely we’ll identify a point this week to add covered calls to enhance the yield.
ANZ goes ex-dividend $0.80 on Monday & WBC also goes ex-dividend $1.00 on Monday.