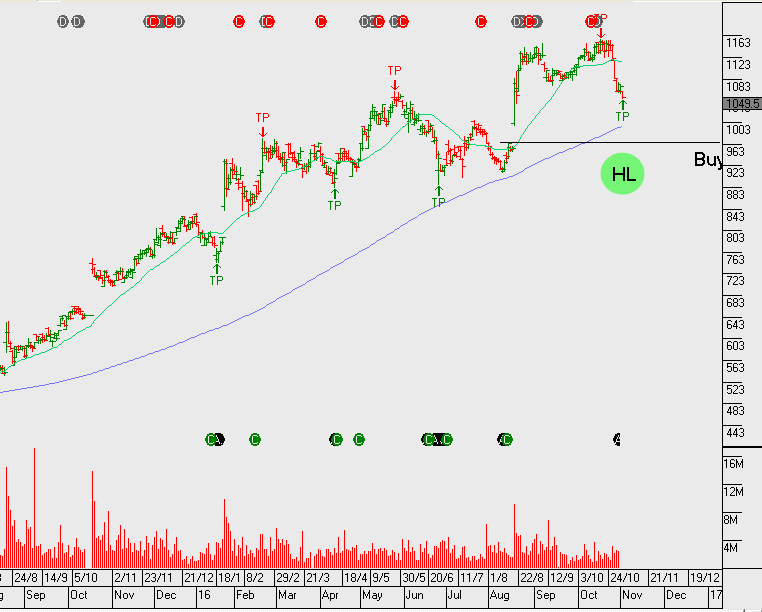
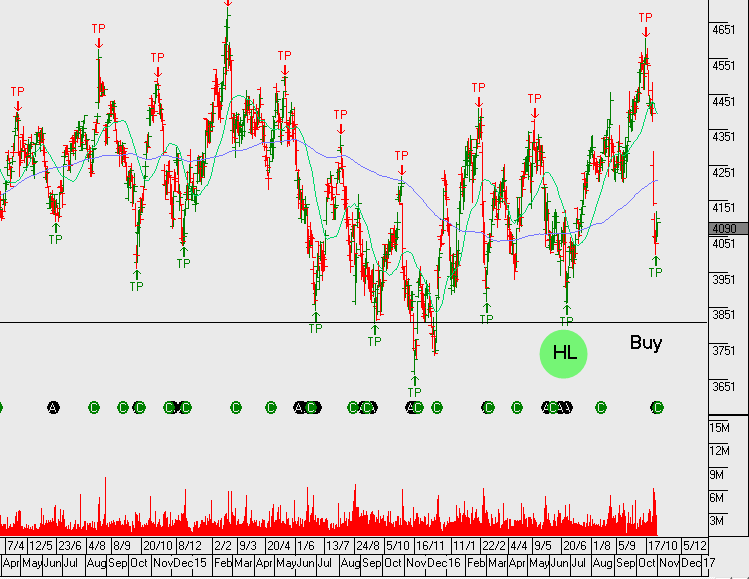
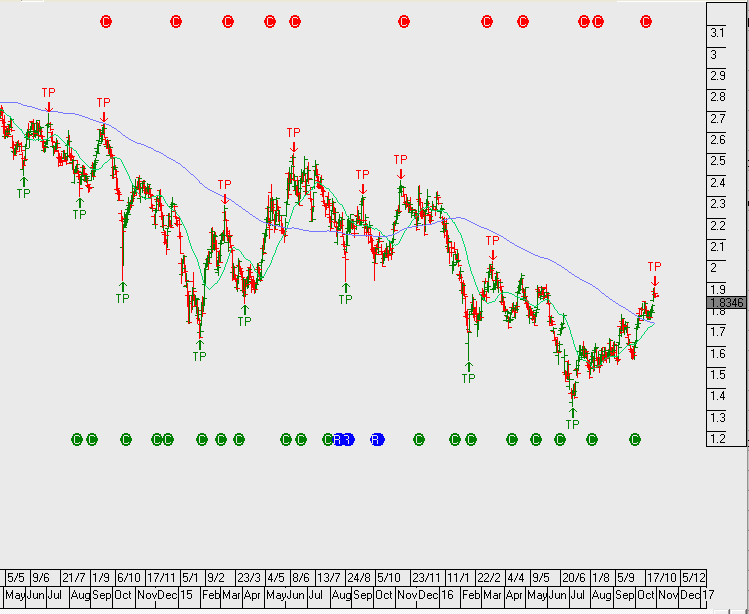
Alibaba beat expectations in its latest report by posting adjusted earnings of 79 cents per share on $5.12 billion in revenue. Analysts were expecting 69 cents per share and $5.03 billion in revenue. In last year’s September quarter, the online retailer posted $3.28 billion in revenue and adjusted earnings of 53 cents per share.
The company announced core commerce revenue grew 41% to $4.3 billion, while cloud computing revenue increased 130% to $224 million. The adjusted EBITDA margin was 46%, compared to 50% during the same period last year.
Digital media grew by 302% to $541 million. The company also announced they had 450 million active users in September, marking a 23 million increase from June.
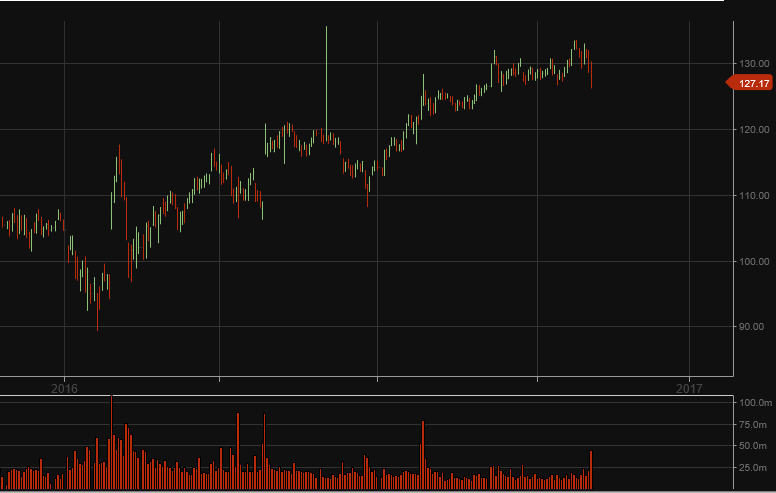
Shares of Alibaba rose in early NY trading, climbing as high as 104.75 before drifting back to 98.50 at the close. The share price has almost doubled since the February low of $60.50 and the next key level of support will be found at the August breakout price of $85.00
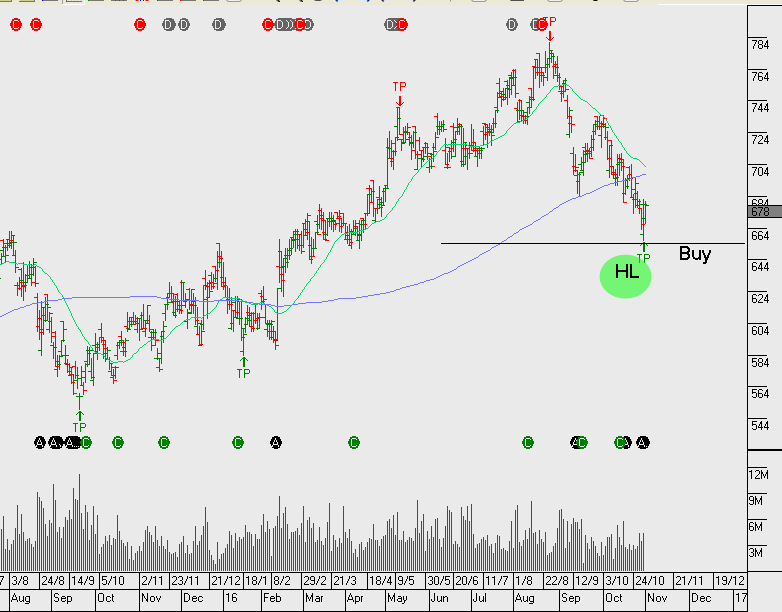
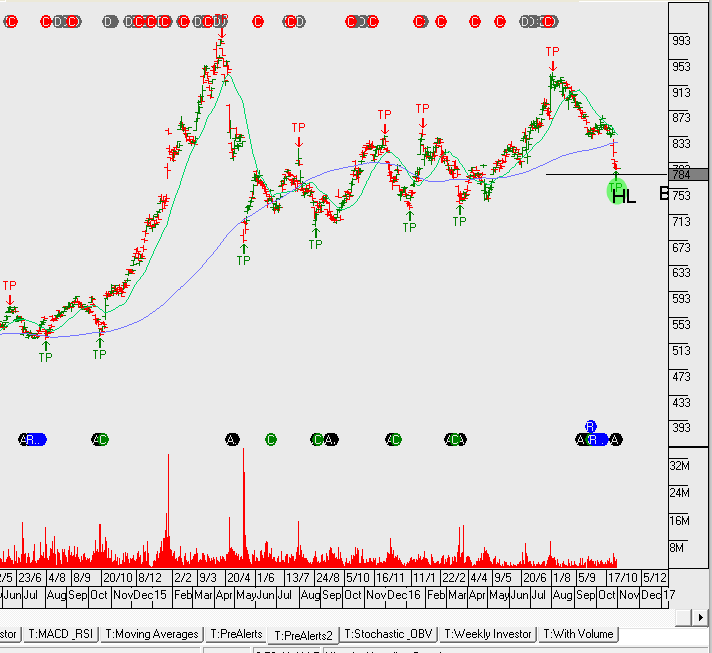
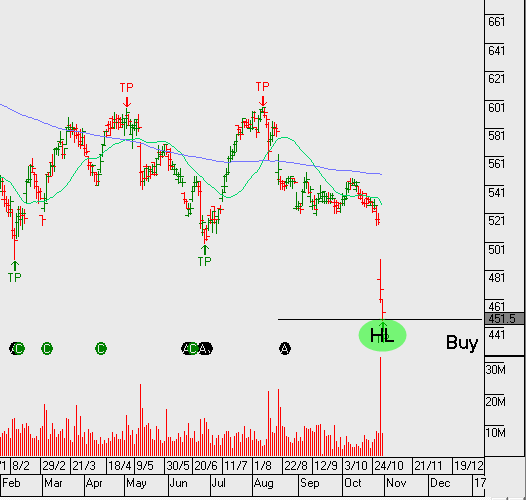
Shares of Facebook are down close to 8% in after-market trading to $117.00 even though the social media giant reported quarterly earnings that beat analysts expectations.
The company announced adjusted earnings of $1.09 per share on revenue of $7.01 billion, up from the comparable year-ago figures of 57 cents per share, adjusted, on $4.5 billion in revenue. Analysts were expecting 97 cents per share on revenue of $6.92 billion.
Advertising revenue was announced at $6.82 billion, above the $6.71 billion consensus estimate. Monthly active users rose to 1.79 billion and signalled the first time more than 1 billion users were active on their phones in a month.
However, share prices fell sharply after CFO David Wehner said the “ad load”, or number of ads on the website, could come down meaningfully after mid-2017 which could impact revenue growth in Q4 2017.
The next support level in the share price will be found at the double bottom price at 108.50 last traded in April and June.
The following group of stocks offer above average earnings growth, structural uptrends and are currently trading back on support levels that warrant closer attention.
More detail on the Investor Signals portfolio allocations and derivative overlay strategy will be provided in the October ASX top 50 Video Market Report.
Over the last two months, bond markets have been repricing the probability of a US rate increase. During that time, we’ve watched the US10YR yields trade up from 1.3% to 1.9% . As a consequence, money managers have sold-off defensive yield names. This has been most evident in ASX 50 names within the infrastructure and property sectors.
We maintain a positive interest in these names as the current share prices now have many of the yields offering 100 basis points, (or 1%), more than they were trading at 2 months ago.
WFD and GMG are now trading back on 4% yield, whereas TCL, SYD, GPT and SCG are on average trading near 5% yield.
The December FOMC rate decision meeting will likely be the catalyst for a bounce, however, we’re not expecting these names to recapture the recent highs. Therefore, we’ll look to sell the rally into the early part of 2017. The algorithm engine will track these names and I’ll be certain to alert you to the next lower structural high, but for the time being, you may want to position around the short term bounce which could offer up to a 10% rally.
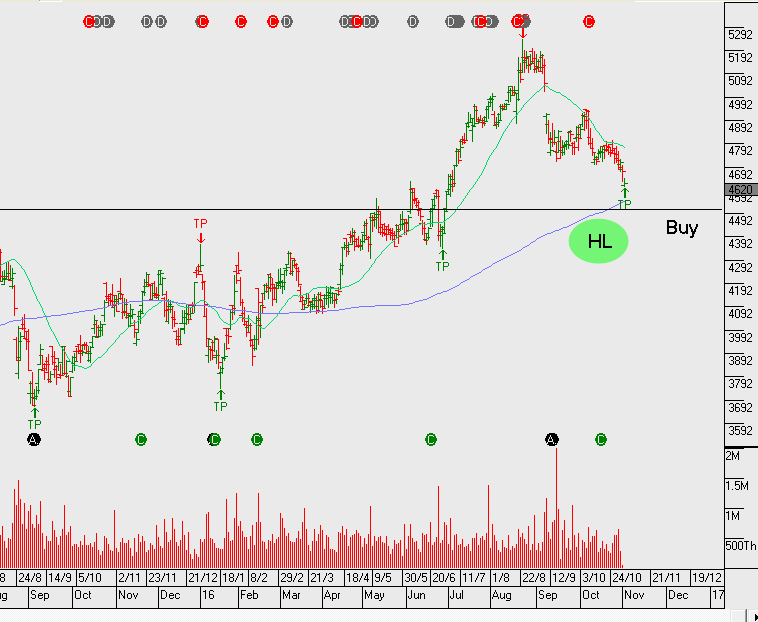
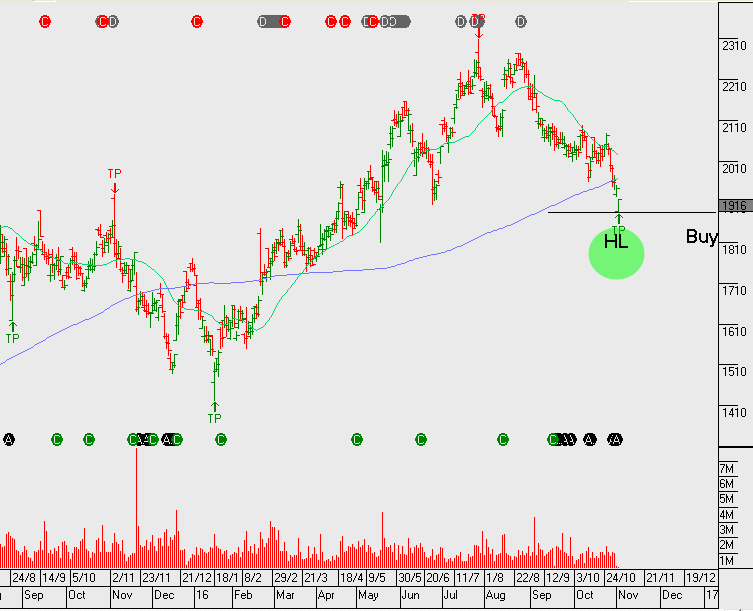
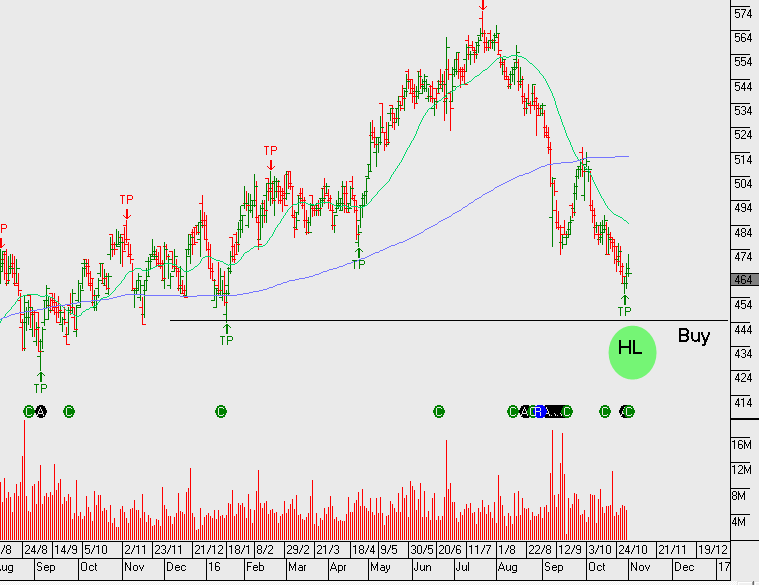
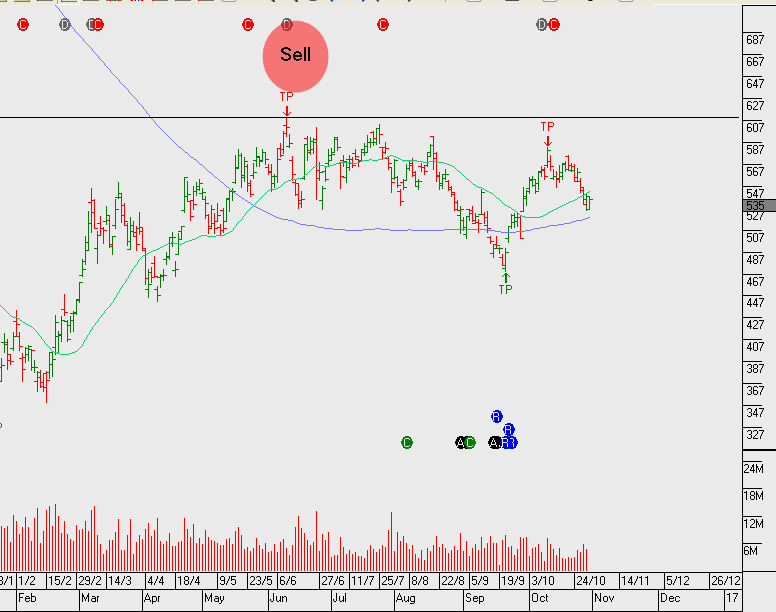
Wesfarmers reported notably weaker 1Q17 sales performance which has weighed heavily on the share price. However, excluding UK home improvement and convenience stores, overall sales rose by 3.4% to $12.9 billion.
Overall, FY17 NPAT has been marginally upgraded as positive price developments in their resources divisions offset lower revenue numbers from Target and Coles. Based on Fy17 DPS of $2.30, Wesfarmers is on 5.2% forward yield.
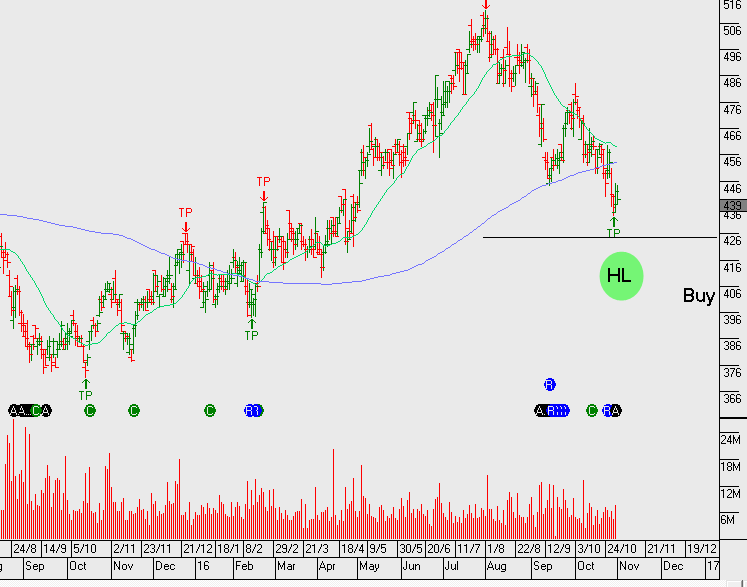
The share price has dropped close to $5.00 over the last four trading sessions and posted a 3 month low of $40.00 last Friday.
We see value emerging again as the stock now trades back at a support level that has been maintained since June 2013. Buy range of $39 – $40 and sell range of $43 – $44. Using covered calls we’re able to boost the cash flow to 10%+ per annum from the dividend, franking credit and call option premium.
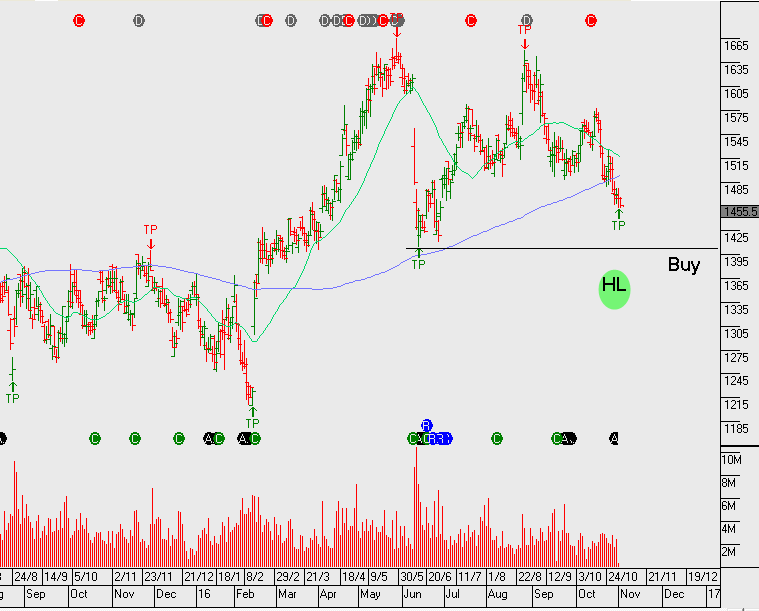
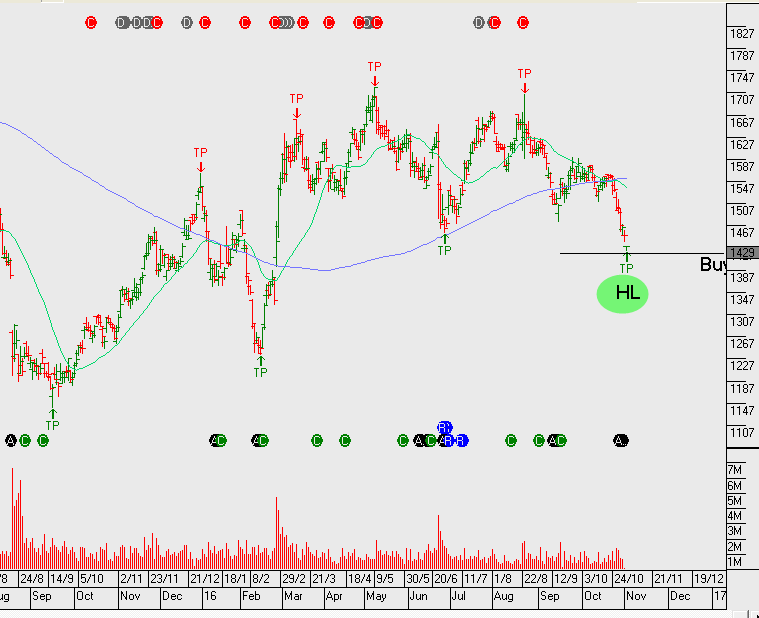
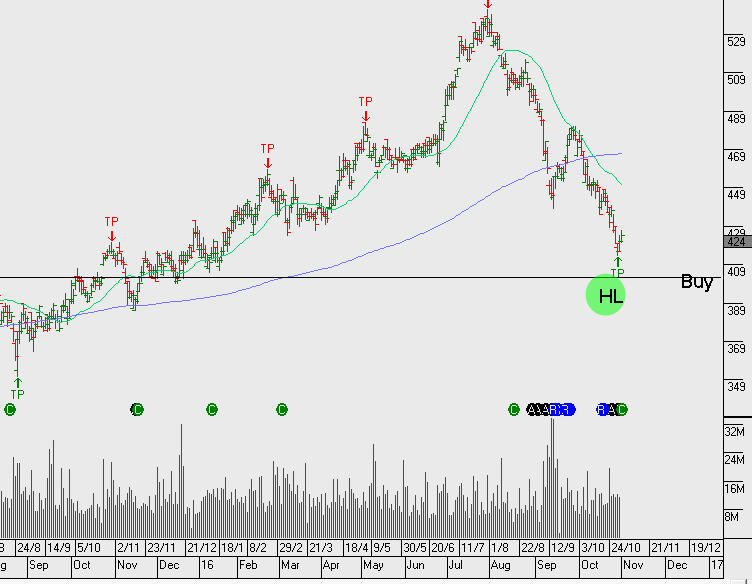
Resmed reported 1Q17 results with adjusted NPAT of $88 million or 3.6% growth on the same time last year.
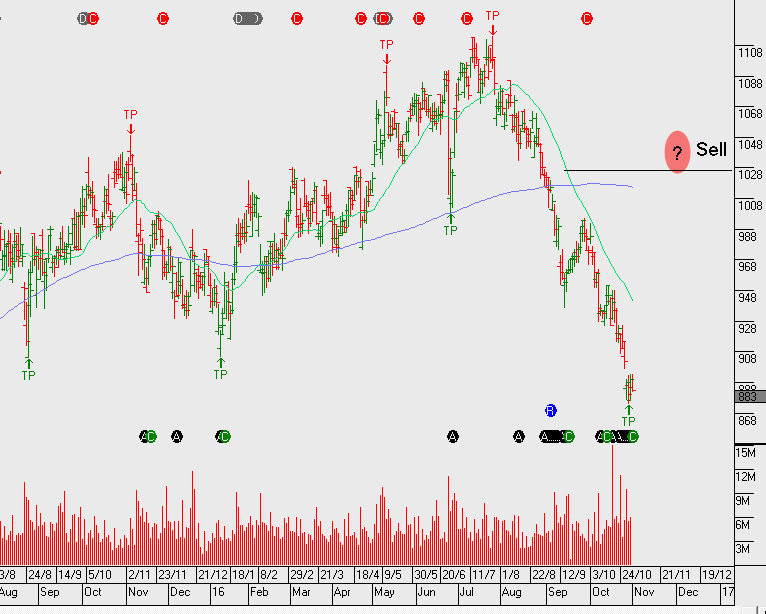
While the improving gross margin is a positive sign, it’s difficult to equate RMD’s 3% organic growth in the first quarter with its recent FY17 multiple of 22x earnings. The recent pull back in the share price to $7.85 could relieve some of this P/E imbalance.
We look to add to the RMD position on the current pullback. A rally back above $8.25 will provide an opportunity to sell covered calls.
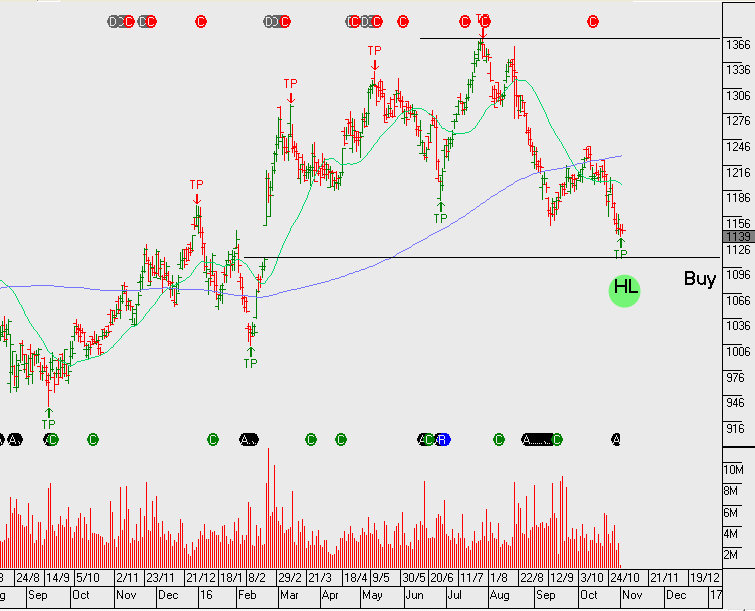
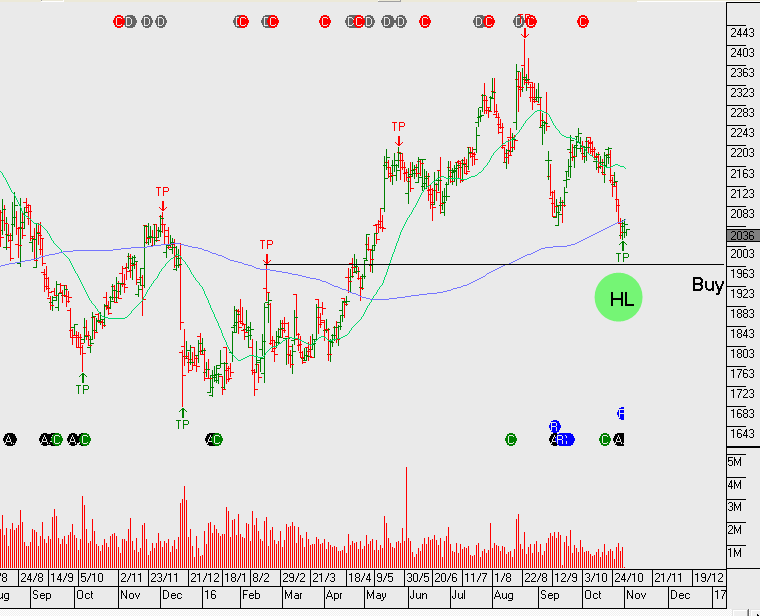
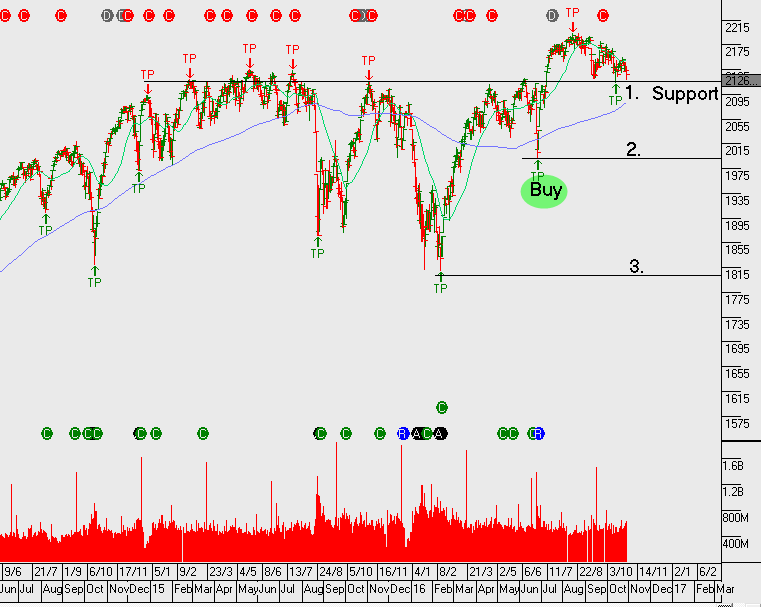
Origin production numbers in the recent quarter displayed some encouraging progress within the LNG business unit. Production volumes increased 8% quarter on quarter and upstream revenue increased 32%.
APLNG T1 continues to operate above nameplate capacity & T2 has now started.
ORG’s balance sheet remains under pressure with $9.1b in debt, although the company is ahead of market guidance with respect to managing the reduction of debt.
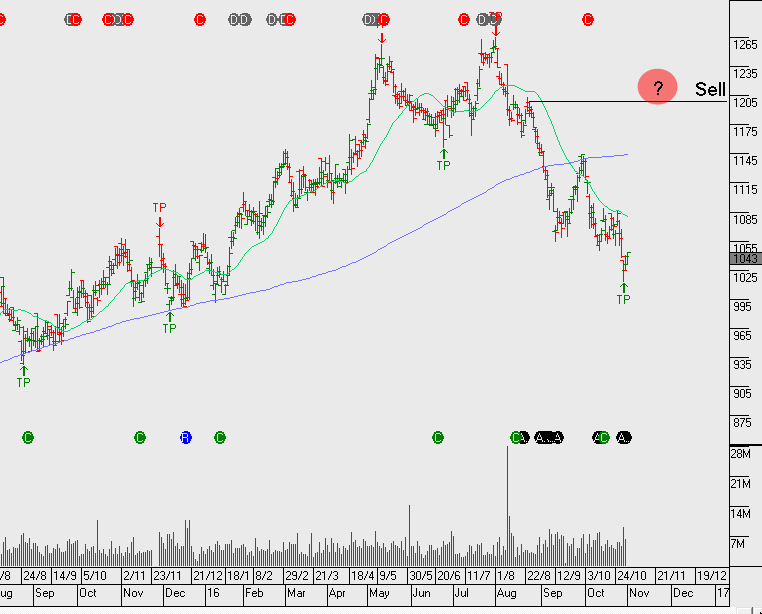
ORG should continue to benefit from its diversified exposure to energy markets. FY17 outlook is for revenue of $12b, net profit of $550m with gearing at 50% and no dividend. FY18 we see a slight improvement in revenue and net profit increasing to $800m and the likely announcement of a return to paying $0.25 per share in dividends. This places the stock on an FY18 yield of 5%.
Origin has options available to unlock shareholder value. We may see a split of their retail division which will open potential acquisition options for Woodside (or others) to consider the Origin LNG assets as an example.
Over the last six months, an overarching theme driving G-10 financial markets has been the divergence in interest rate policy trajectory between the US Federal Reserve and the rest of the group. From a “cause and effect” point of view, US economic data has been viewed through a prism of how it could influence policy decisions from the FOMC, which has then impacted the way G-10 assets respond relative to US assets.
In short, key fundamental data points which print better than expected have been bullish for the USD and bond yields, and economic reports which reflect weakness in the US have been bearish for the USD and bullish for US stocks. However, last Friday’s trading session illustrated how these correlations will likely be suspended until after the US Presidential election on November 8th.
Friday’s NY trading session began with the release of the highest Advanced GDP report in two years. As expected, the USD Index rallied to a 9-month high just under 99.00 and the EUR/USD slipped to the low end of the range near 1.0850. At around 1:00 PM, NY time, news hit the wire that the FBI said it would reopen its investigation into Hillary Clinton’s private e-mail server after new evidence was discovered on other electronic devices in an unrelated case. The market acted swiftly as the EUR/USD jumped 90 points, bond yields fell and the SP 500 dropped 20 handles from 2140 to 2120 before recovering.
We won’t discuss the validity of the FBI’s decision. However, from a market participants point of view, the important thing to note is that anytime there’s an opening for Don Trump to close the polling gap it means more uncertainty on the horizon and less chance of a rate adjustment this December from the FOMC. As such, we will offer to explain some of the dynamics we could be up against over the next several trading sessions.
It seems the market’s fear of a Trump victory is focused on his proposed tax cuts leading to higher deficits and a steeper yield curve. Some other analysts believe his trade policies could trigger a sell-off in equities and a flight to quality into the long-end of US Treasuries.
Using the “Brexit” vote as a point of reference, a Trump win could trigger a sharp rise in volatility in bonds, FX and equities. And while the spike in asset volatility was short-lived as the VIX moved back to pre-Brexit levels by early July, the impact on the yield curve lasted much longer. The UK referendum was on June 23rd, and it took until mid-September for the UK 10-year Gilt yields to rise above their pre-Brexit levels. There is a similar fear in the US Treasury market if Don trump wins.
In this respect, it’s our view that this week’s fundamental news (which includes 3 Central bank meetings and European PMI’s) will take a back seat to the re-pricing of last week’s forgone conclusion that Hillary Clinton will win the US election.
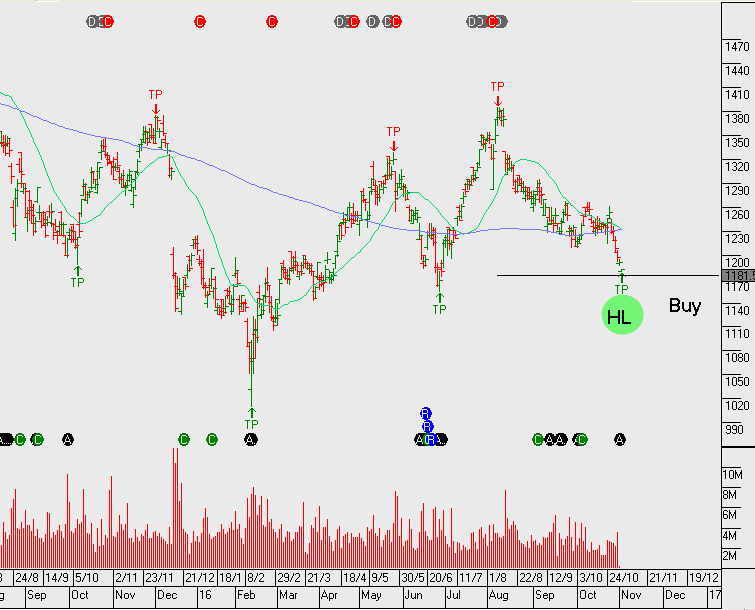
AMP 3Q16 update produced further losses and write downs in life insurance with significant deterioration in Contemporary Wealth Protection.
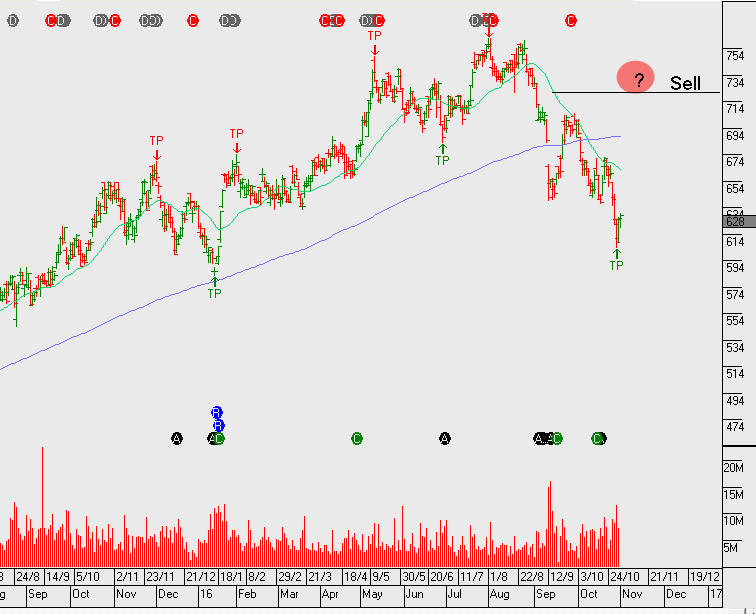
Going forward, the market is likely to place a greater focus on AMP’s more important wealth management business. AMP is trading on 13x FY17 earnings and now offers a 6% dividend yield.
FY17 net profit should be around $920m on EPS of $0.34 and DPS of $0.28
We’ve been cautious of AMP despite the bullish analyst forecasts over recent time. In last month’s strategy piece we highlighted the relative underperformance to other financial names. This was enough of a warning sign for us not to allocate funds, however, following the sell-off on Friday, we now think value exists in the range of $4.20 to $4.50.
Due to the elevated volatility, we prefer using a spread option strategy to capture the upside whilst quantifying or protecting our downside risk.
A little more than three months ago the citizens of the UK voted to leave the European Union (EU). In the lead-up to the June 24th referendum, many economists predicted an immediate recession and economic chaos on a “Yes” vote.
This sentiment was echoed by then PM David Cameron who said a vote to leave the EU would cause an economic shock that would cost the nation at least 500,000 jobs. This warning, along with UK Treasury predictions of the longer-term damage “Brexit” would cause were the cornerstones to what Brexit supports called “project fear”.
Furthermore, many international institutions — including the Bank of England and the International Monetary Fund — also warned that leaving the EU would have dire economic costs.
However, after yesterday’s stronger-than-expected UK GDP report, project fear now seems like an abjectly partisan political tactic and an economic non-starter.
In fact, the first official growth figures since the Brexit have not only confounded the governments warnings of a recession, but given validation to the few economic pundits who predicted the UK would be better off outside of the EU.
The numbers weren’t stellar, but, according to the Office for National Statistics, the UK economy grew by 0.5% between July and September. The UK Treasury had predicted it would shrink by 0.1%.
And while it’s clear that the Bank of England won’t be removing stimulus anytime soon, it appears that the fundamentals of the UK economy are strong and the GDP data show that the economy is resilient. The internal data in the report reflected an expansion at a rate broadly similar to that seen since 2015 and there’s really little evidence of a pronounced negative effect in the immediate aftermath of the Brexit decision.
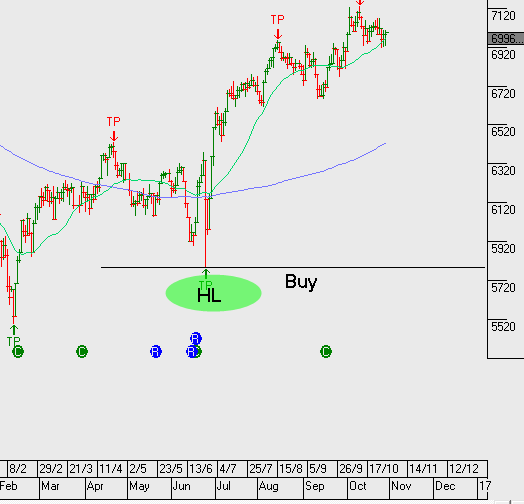
This nascent sense of stability and cautious optimism is best illustrated in the UK Treasury curve. Since bottoming out at .530% in mid-August, the 10-year Gilt yields have more than doubled and have now traded at a six-month high at 1.285% after the GDP data. In addition, over the same period of time, the FTSE 100 index has climbed over 4% from 6750.00 to close to 7,000.00
The question now is: when will the higher UK rates, firmer stock market and stable economic data translate into a stronger Sterling?
In our view, the answer is very soon.
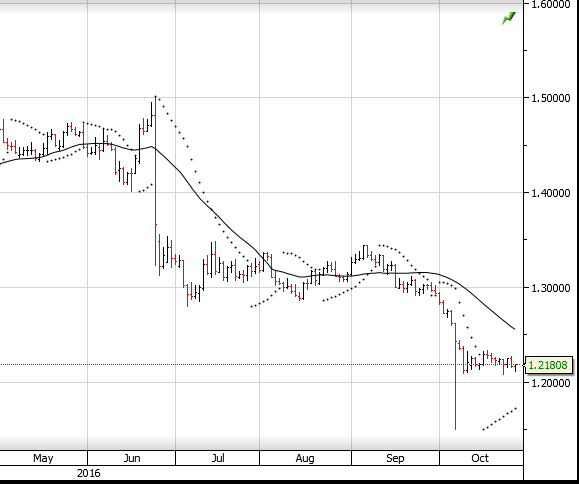
Looking at the daily GBP/USD chart, it’s clear that the “flash crash” on October 7th is still the most dominate technical feature. However, with the market positioning leaning very heavy to the short side, and very little swap benefit in holding short Sterling without downside price momentum, it’s reasonable to expect the risk of a short squeeze is increasing.
Chart – GBP/USDChart – FTSE
Sophisticated Investor?
We have special opportunities available for Sophisticated Investors. If you're interested, and qualify, please provide your details below.