XJO – 5830 Support
The XJO has found support on the resistance level of 5830. If we see the price action turn-down through this support range, we recommend investors increase their hedging exposure.
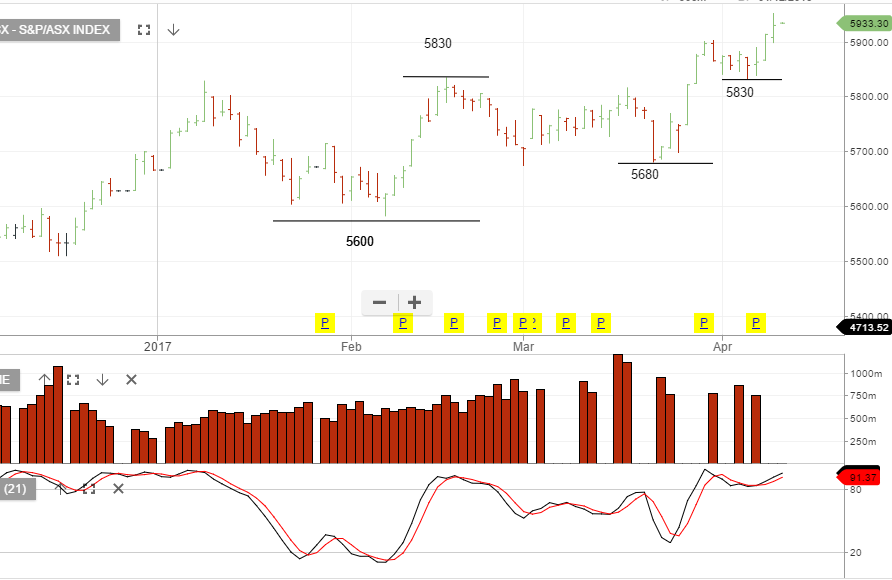
The XJO has found support on the resistance level of 5830. If we see the price action turn-down through this support range, we recommend investors increase their hedging exposure.
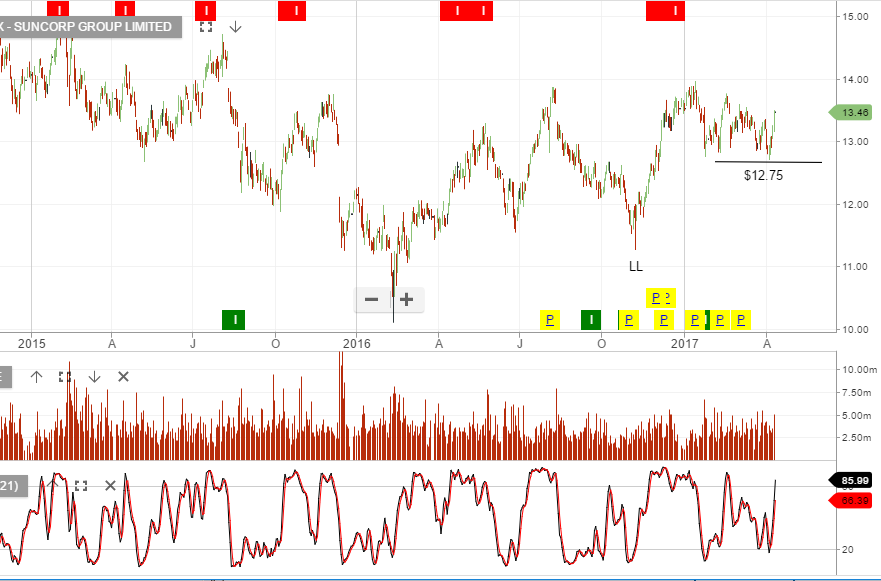
After a series of lower high structures over the past 2 years Suncorp looks to have found a short-term consolidation range with $12.75 support and $14 resistance.
We recently took profit in our long Suncorp exposure when the stock was last trading $13.75. The stock is now back on our watch list but a break below $12.75 will show the downtrend remains the primary driver.
The Vaneck Vectors Gold Miners ETF is building a higher low structure and we have an upside price target of $35 with a stop-loss below $29.40

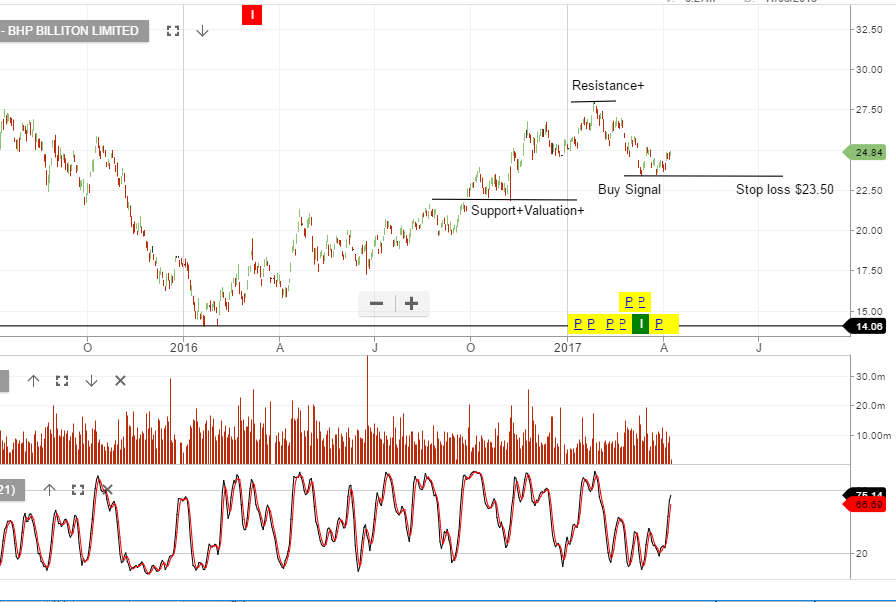
Yesterday’s 5% rally in BHP left a many investors wondering what was driving the shares on a quiet Monday session.
The main reason was a report that Elliott Advisors suggested the company could unlock shareholder value by spinning off US Petroleum and collapse of the LTD and PLC shareholdings.
The idea is that the Elliott plan would accelerate the release of value and franking credits. Of course, the $6.00 rally in Crude Oil since March 27th has also been a boost to BHP shares.
Our ALGO engine generated a buy signal for BHP on March 13th at $23.65.
We remain cautious of the extended valuation of equities, in general, and suggest placing a stop in the $24.40 level on long positions.
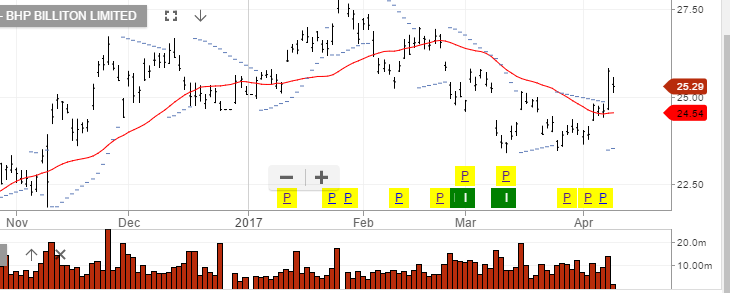 Chart BHP
The Betashare Crude Oil Index has now rallied 10% from the recent low. At an individual stock level, our preferred energy plays remain WPL, OSH & ORG.
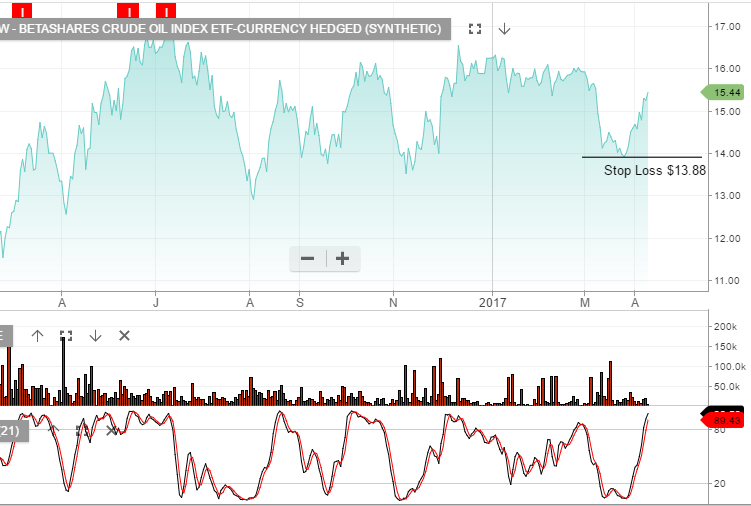
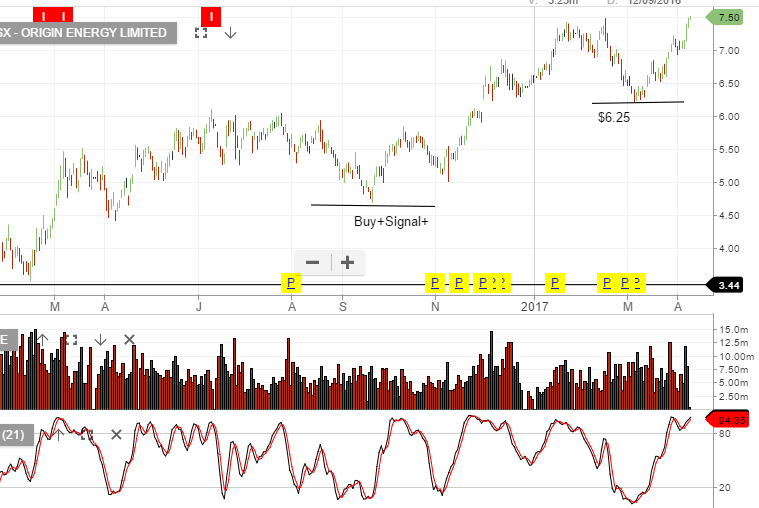
Our Algo Engine triggered buy signals in BHP and ORG. The share price has since rallied in both examples and we lift the stop-loss to the entry price to ensure we protect the long exposure ahead of an expected pick-up in market volatility across the coming months.
When we last updated Ramsay Health Care (RHC) on March 7th, we pointed out that the strong earnings potential and solid dividend growth were reasons for holding the stock.
Since then, RHC has moved just over 5% higher and has a bullish technical structure.
The current price is comfortably above the 30-day moving average at $67.75 and we have a medium-term target of $73.00.
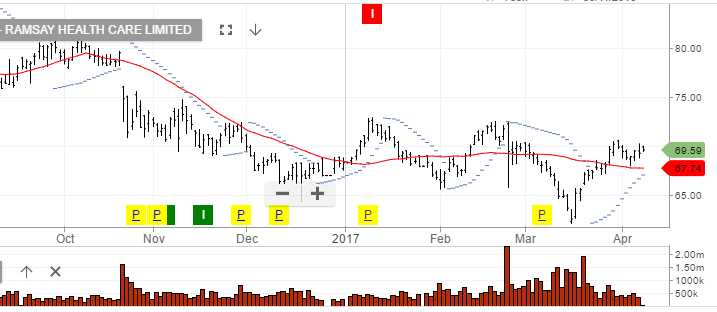
Ramsey Healthcare
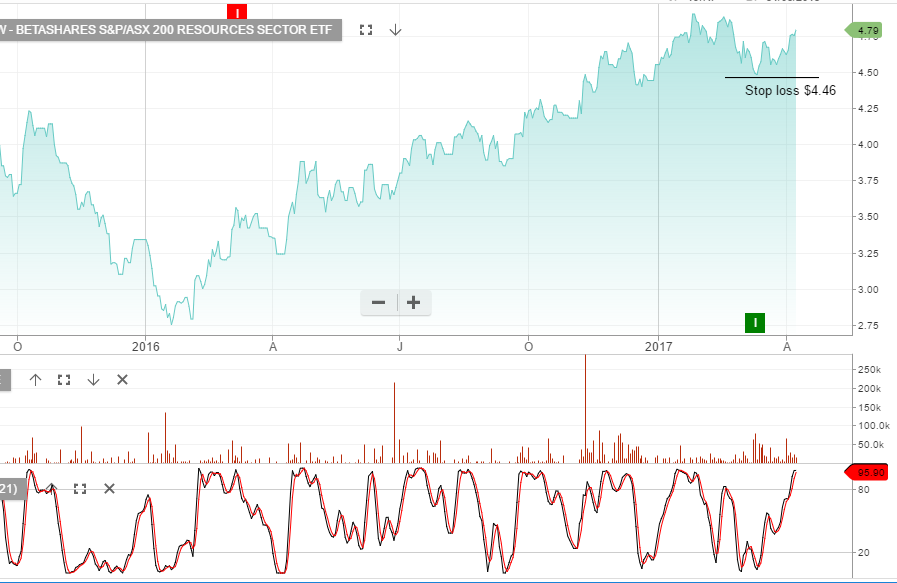
Two ETF’s that we’re now including in our portfolio construction include.
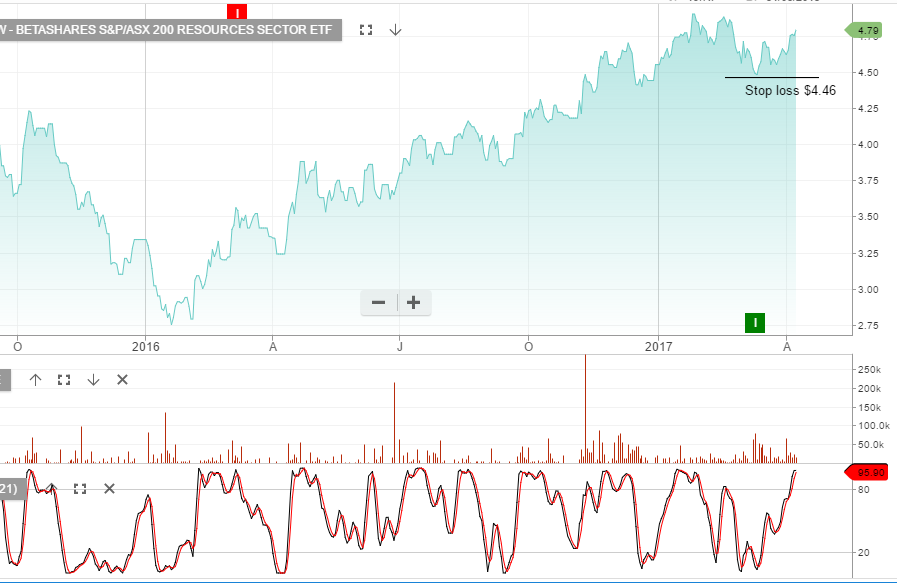
SFY.AXW SPDR S&P50 Fund & the QRE.AXW Betashares S&PASX200 Resources ETF

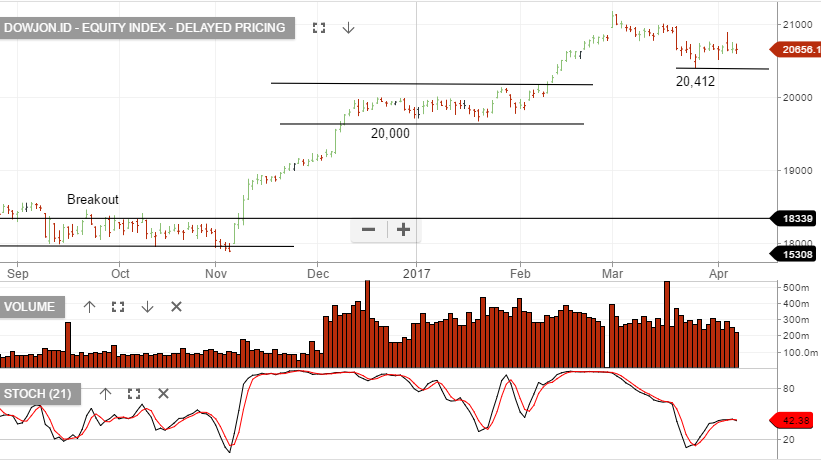
The Dow Jones is holding above the 20,412 low. A break below will be negative for US equities.
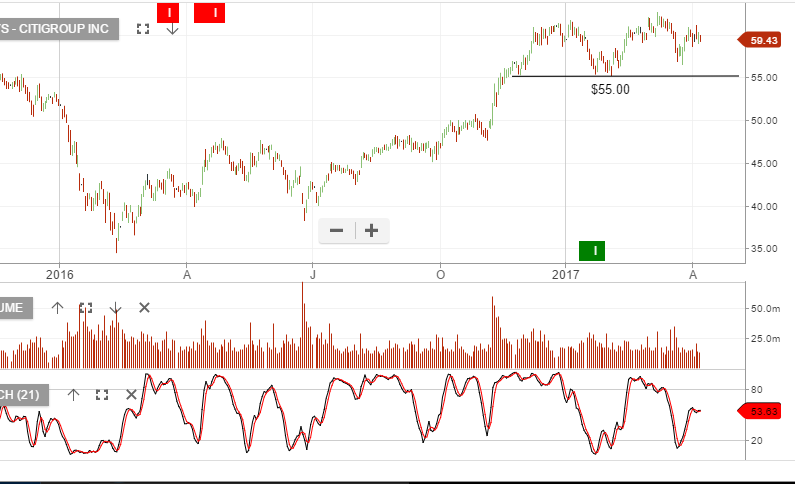
US Q1 17 earnings kick-off next week. Citigroup will be of particular interest when it reports on Thursday.
The XJO continues to make higher low formations with 5830 providing buying support throughout the past week. If we see price action break below 5830 and then form resistance, we’ll view this as the beginning of structural weakness for the local market.


Level 17 Chifley Tower
2 Chifley Square
Sydney, NSW 2000
1300 614 002
Investor Signals Pty Ltd
ABN 44 143 555 453