Stocks to Watch – Recent Algo Signals
The following group of stocks have recently been flagged by our Algo Engine.
Algo buy signals include; BHP, RIO, FMG, S32 & QBE;
Algo sell signals include; NCM & OSH.
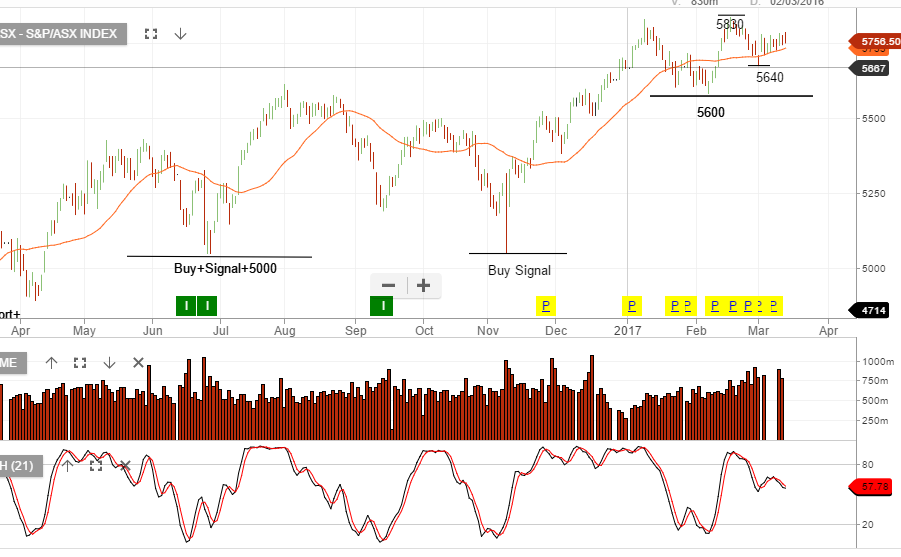
The following group of stocks have recently been flagged by our Algo Engine.
Algo buy signals include; BHP, RIO, FMG, S32 & QBE;
Algo sell signals include; NCM & OSH.
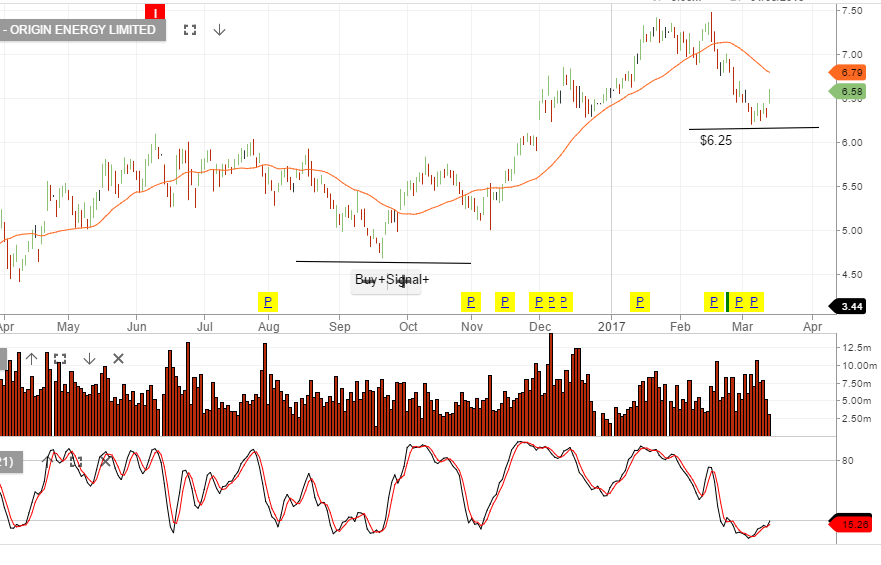
Origin continues to look well supported as the price bounces from the recent “higher low” formation at or near $6.20
The US Federal Reserve will make their decision on interest rates this Thursday at 5 am, Sydney time.
An adjustment of 25 basis point to 1% for the Fed Funds target is now priced into the market.
As such, equity investors will be focused on the forward guidance about the pace and trajectory of US rates into 2018, and beyond.
This forward guidance will come in form of the FED’s “Dot Plots.” The dot plots are essentially a graphic reflection of where the FED members believe interest rates will be trading out until the year 2020.
For most equity investors, the key data will be how many rate hikes are expected to occur in 2017. When the FED raised the FED Funds target in December, the dot plots showed a consensus of three rates hikes during 2017.
The risk to the US equity market is that the FED dots plots are revised higher to include an additional rate hike for 2017.
If that’s the case, it’s reasonable to expect US stock indexes to trade lower, the USD to trade higher and US Treasury yields to continue to firm.
Since posting a high trade of .7740 on February 23rd, the AUD/USD has dropped over 250 points , or 3.2%.
A corrective bounce into the weekend sees the Aussie currently trading back near .7540, but the technical chart structure looks weak and momentum indicators are point lower.
In addition, The US Federal Reserve is a near certainty to raise the Fed Funds target this Wednesday.
This policy move will lift the Fed Funds target to 1%, and, (with Aussie overnight rates at 1.5%) will further narrow the overnight lending rate spread to just 50 basis points.
This fundamental shift will likely accelerate the repricing of the AUD/USD back into the .7300 handle.
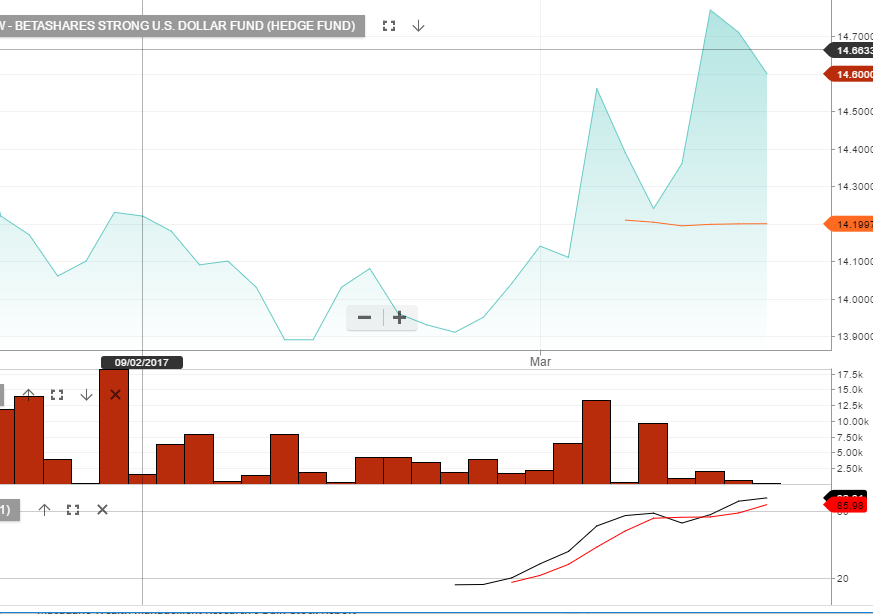
Investors can profit from the AUD/USD moving lower with the BetaShare YANK Exchange Traded Fund (ETF).
YANK is an inverse, unit trust EFT with a weighing of approximately 2.5 to 1. This means that a 1% drop in the AUD/USD price will increase the value of the ETF units by approximately 2.5%.
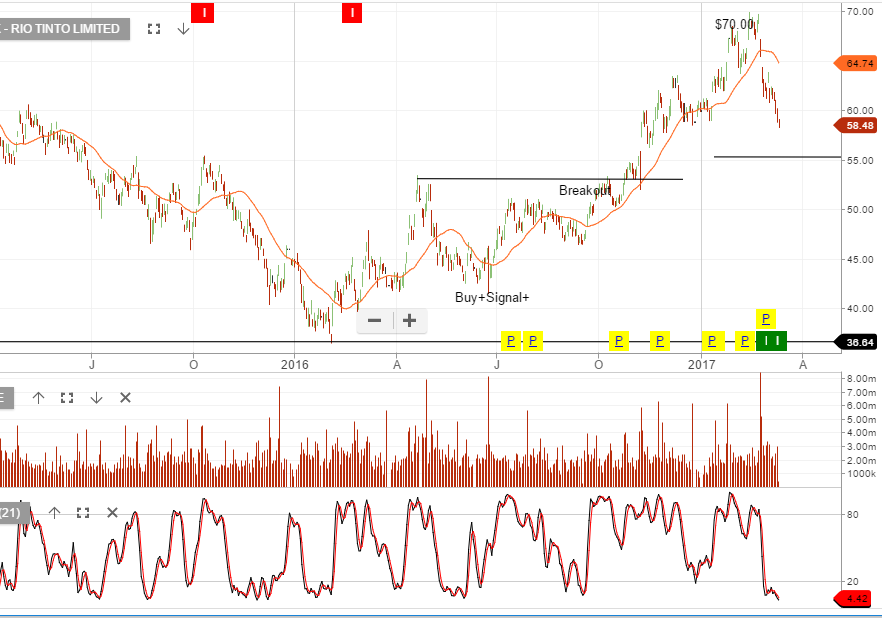
Our Algo Engine is now flagging “higher low” structures in a number of the large cap commodity names; across both metals and energy sector.
In particular, BHP and RIO are now at levels where a technical bounce is likely to occur.
Although, we struggle with the timing of establishing new long positions, given our current valuation concerns at an index level.
We’ll watch the price behaviour in BHP and RIO this week and look for evidence of the short term momentum indicators turning positive.
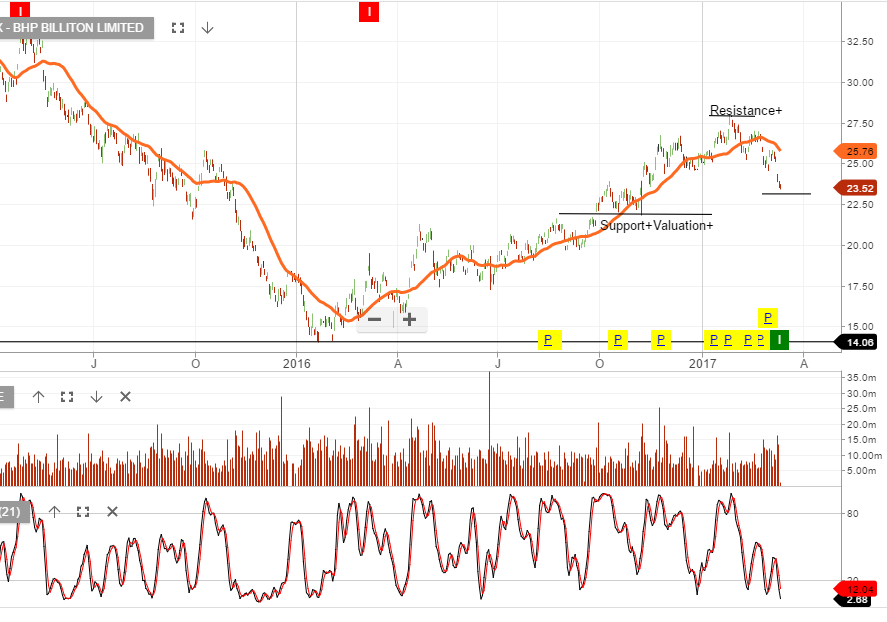 Chart – BHP
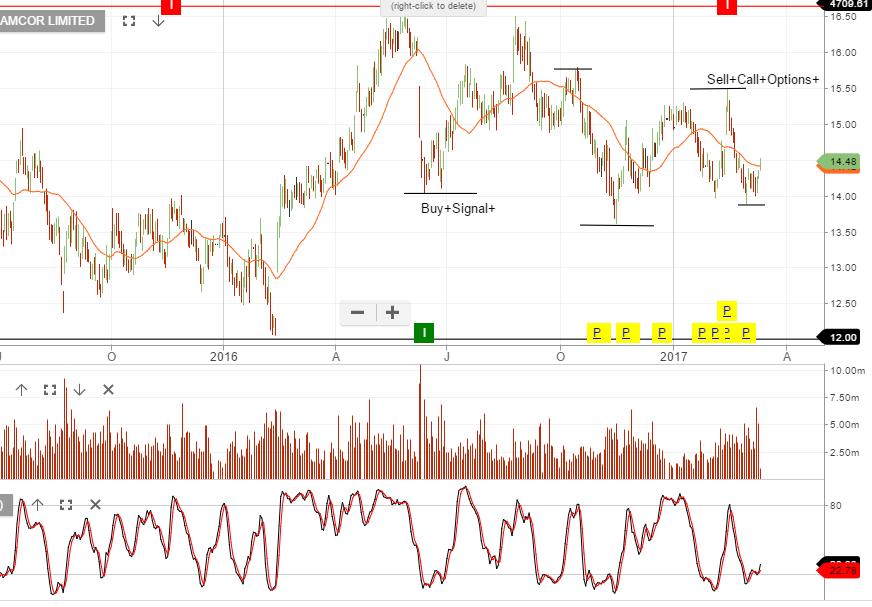
We’ve been buyers of AMC and continue to see upside to the $15.00 level, where we recommend selling covered call options to enhance the return.
We’ve been buyers of Tabcorp and continue to see upside potential to $5.00.

The FOMC is pretty much certain to raise the Fed Funds target rate to 1% on Wednesday.
The US employment report released last night was mixed, with the headline number of 235,000 new jobs above expectations, the hourly earnings growth below expectations at .2% and the Unemployment rate unchanged at 4.7%.
These data were solid enough to hold the US indexes within recent ranges and even move the odds of a June rate hike slightly above 50%.
However, there are several other events next week which could also move the market.
On Tuesday, UK PM Theresa May will be addressing the House of Commons. There is a good chance that she may announce Article 50, which will formally start the Brexit process.
On Wednesday, Dutch citizens go to the polls to elect a new PM. The anti-EU candidate, Geert Wilders has a very good chance of winning.
Also on Wednesday, the US Debt ceiling agreement from 2015 will expire, further clouding an already murky legislative agenda in the USA.
On Thursday, the Australian employment report will be released, which will have an acute bearing on future domestic interest rate policy measures.
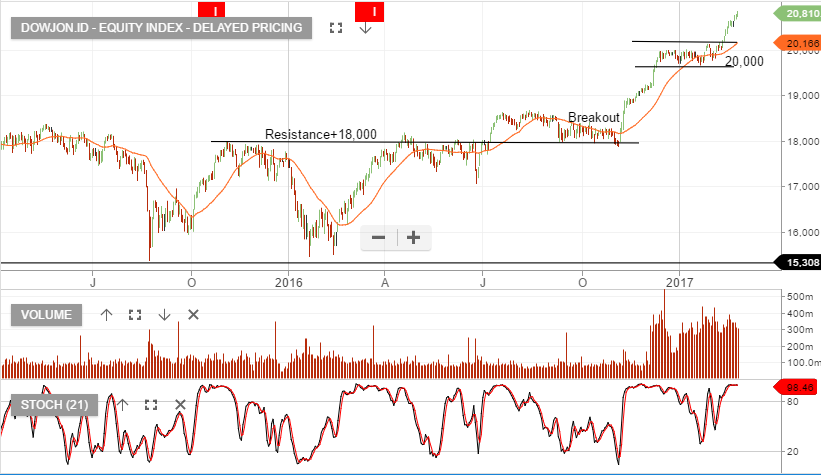
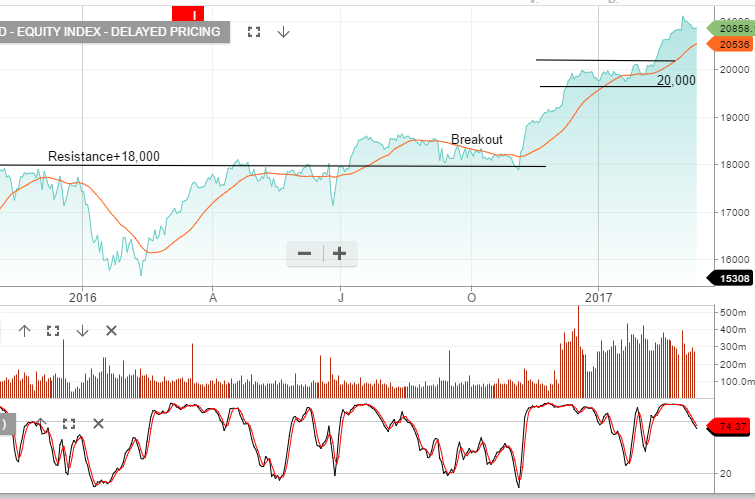
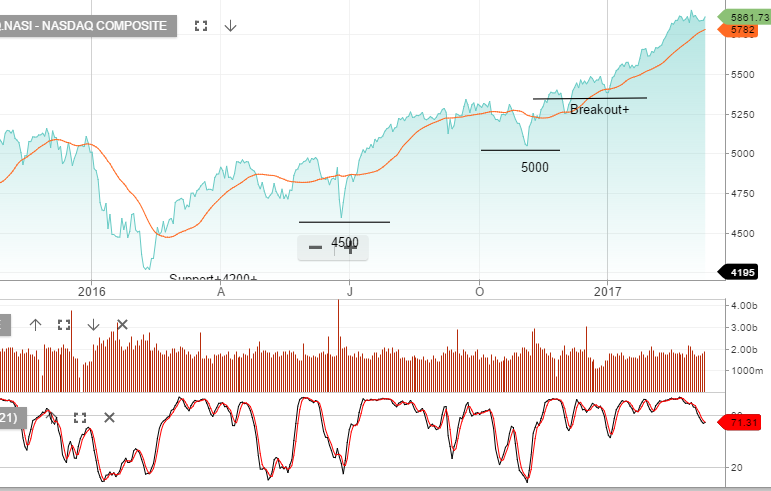
The Dow Jones had a minor retracement from the 1 March high of 21,169 to close the week out at 20,902. Wednesday in the US will see the Fed Reserve hand down their decision on US rates, with the market now pricing in a 92% chance of a .25% increase.
Interestingly, defensive names such as consumer staples have been some of the best performing stocks, (on a relative basis), when compared to other market sectors over the past month. In many cases, we’re now seeing PE ratios extend to 22x earnings and yields compressing down to 2.2%.
Dow leaders such as Boeing & Goldman Sachs are selling off after their terrific rally and GE, which has under performed lately, showed strength in Friday’s session.
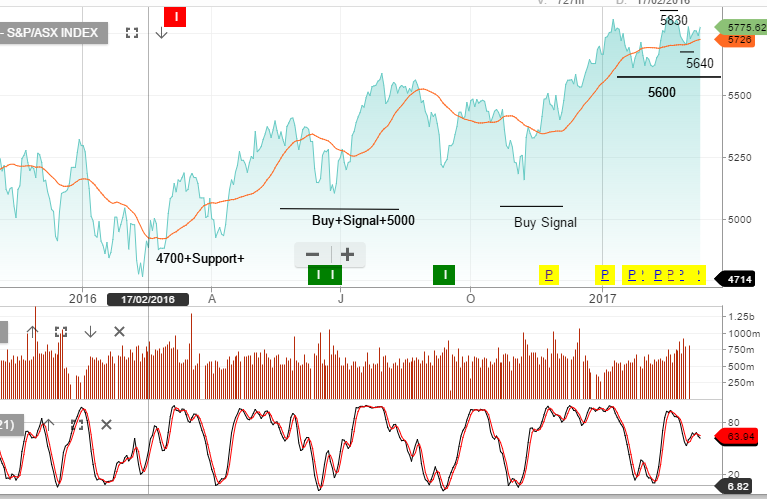
Due to stretched equity valuations, we’re most likely to see further consolidation in the major indices.
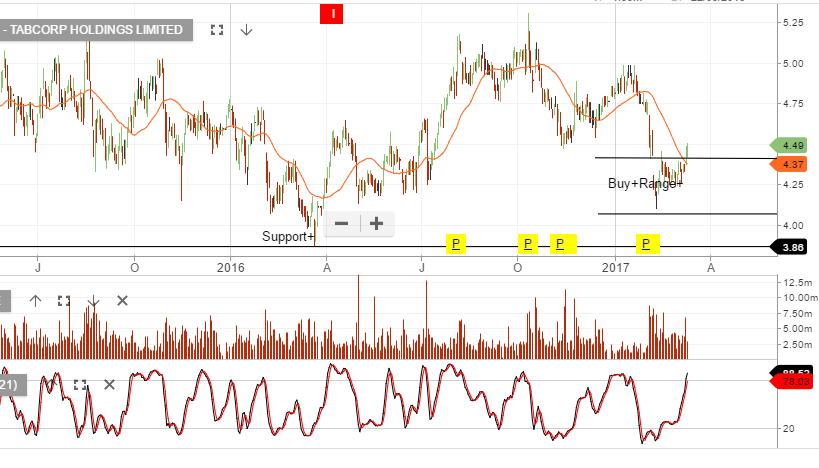
Shares of Tabcorp have had a good week and are pushing up against the $4.50 level in early trade.
Before the open yesterday, the ACCC, Australia’s competition watchdog committee, gave an upbeat report that some of the “red-light” issues facing Tabcorp and Tatts‘ proposed $11 billion merger can be easily resolved.
However, the ACCC did say that the merger details would require more time to get the rubber stamp.
One of these hurdles could be overcome by Tabcorp selling its Queensland electronic gaming monitoring business, Odyssey Gaming.
As a defensive name, we have been buying Tabcorp for client accounts in the $4.20 to $4.50 range since early February.

Level 17 Chifley Tower
2 Chifley Square
Sydney, NSW 2000
1300 614 002
Investor Signals Pty Ltd
ABN 44 143 555 453