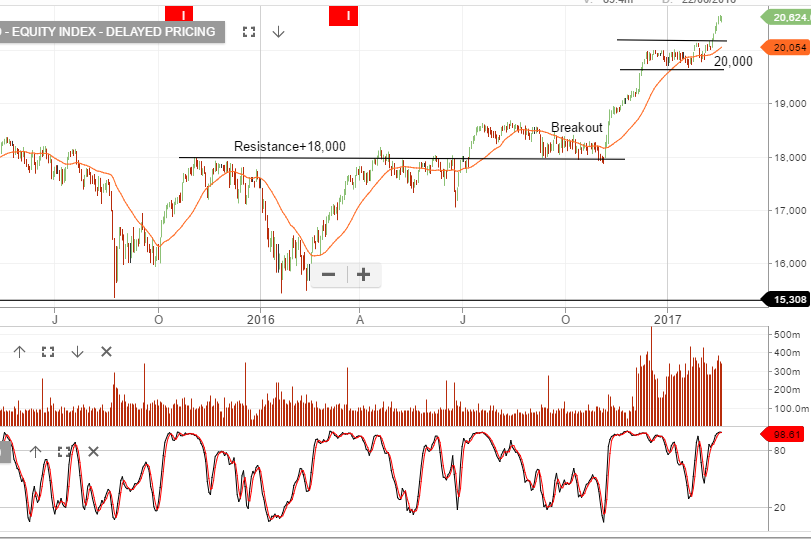
China & Our “Risk” Scenario

Chinese foreign exchange reserves dropped below $3 trillion in January for the first time almost 6 years. That’s down from $4 trillion in 2014.  The drop is largely caused by the Chinese central bank  intervening in the FX market as they buy yuan to prop-up the currency against the US dollar.

Overseas direct investment from China fell by 35% in January, compared to a year ago & Chinese investment in overseas property dropped by 84%.

Over-inflated Chinese property prices and the risk of their property bubble bursting, is a concern. We’re tracking resale data in the major cities and there’s evidence of price declines emerging since November of last year.

These are trends we’re watching closely as they form the basis of our “risk” scenario for global equities, especially given the gap between forward PE valuations and probable 2017 earnings growth.

China – iShares China Large CAP ETF


Boral – Chart Review

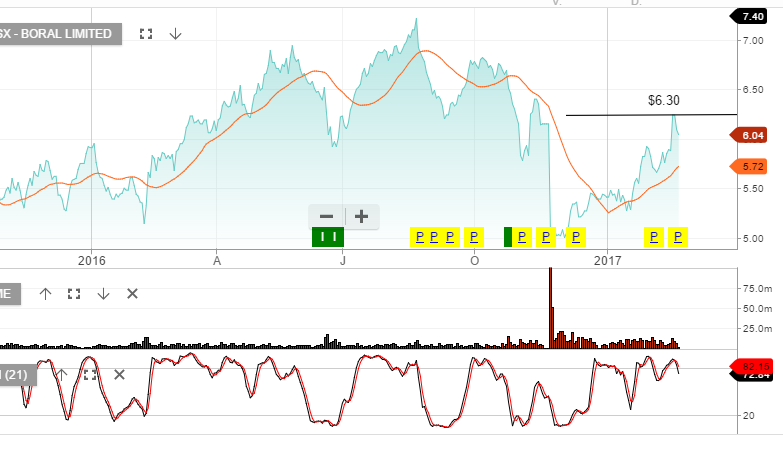
Boral has created a negative pricing structure following the stock making a lower low and then a lower high at $6.35 in last week’s trading.

With our general concerns around both domestic and US housing construction trends, combined with Boral’s  high valuation and moderate underlying earnings growth, we think this is worth keeping on your “short signal” list.

Chart – BLD


ANZ – December Quarter Earnings

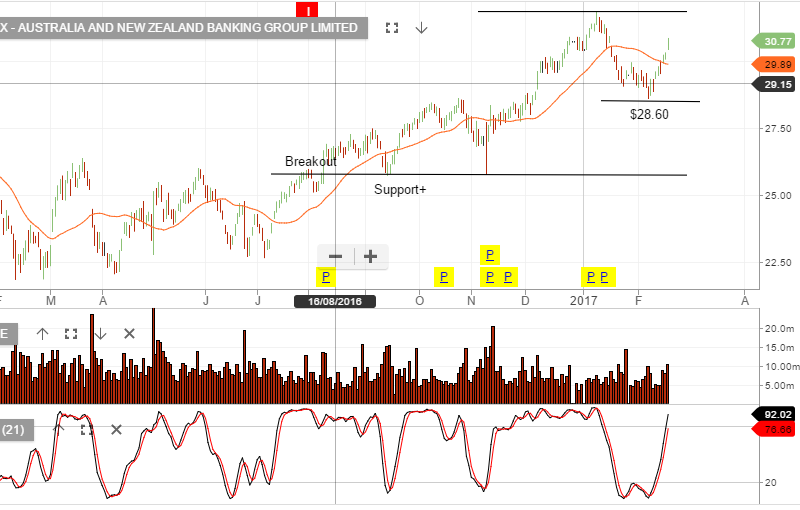
The headline data from ANZ shows that the bank had a strong start to FY 2017. However, the pick-up in property and trading income are going to be difficult to replicate into H2 2017.

ANZ delivered around $2 billion in cash profit, which was well above the street’s expectations of $1.7 billion. The higher numbers were underpinned by strong trading income and a $283 million bad debt charge versus an expected $446 million charge.

We note that historically ANZ has had higher Q2 bad debt charges compared to Q1

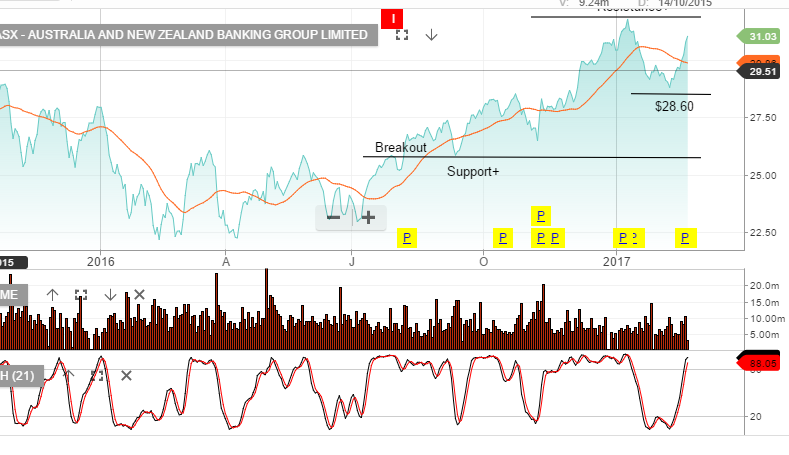
We would expect price resistance to emerge at or around the January 9th high of $31.80.

Chart – ANZ

Brambles Down Sharply

Shares of Brambles are trading over 8% lower in early trade as the pallet maker announced profits will fall well short of their original guidance.

For the first 6 months of the fiscal year, the company reported a 26% fall in net profit to USD 330.4 million. The drop was a largely blamed by a sharp write down on its Hoover Ferguson Group venture, as well as, margin pressure in its US business.

Back in November the company’s guidance suggested constant-currency sales growth in the 7 to 9% range and underlying profit growth in the 9 to 11% range.

Brambles declared an interim dividend of 14.5 cents a share.

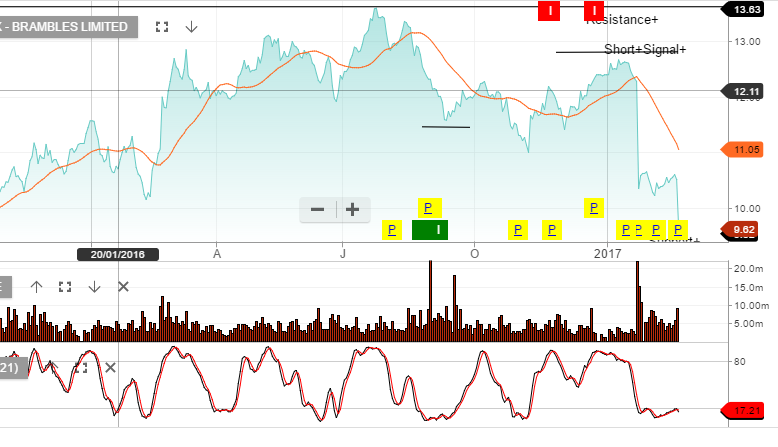
Subscribers will remember that the Algo engine gave a sell signal on January 4th at $12.50. Brambles shares hit an 18-month low  $9.54 earlier today.

Chart – BXB

Banks – Chart Update

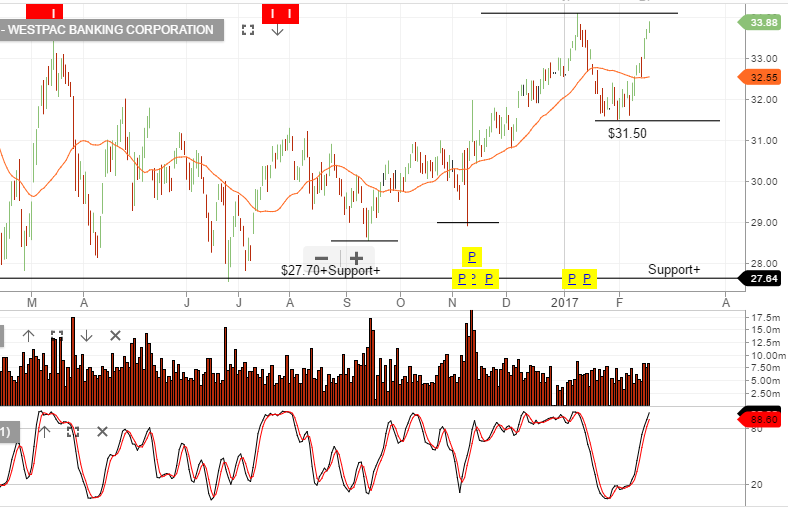
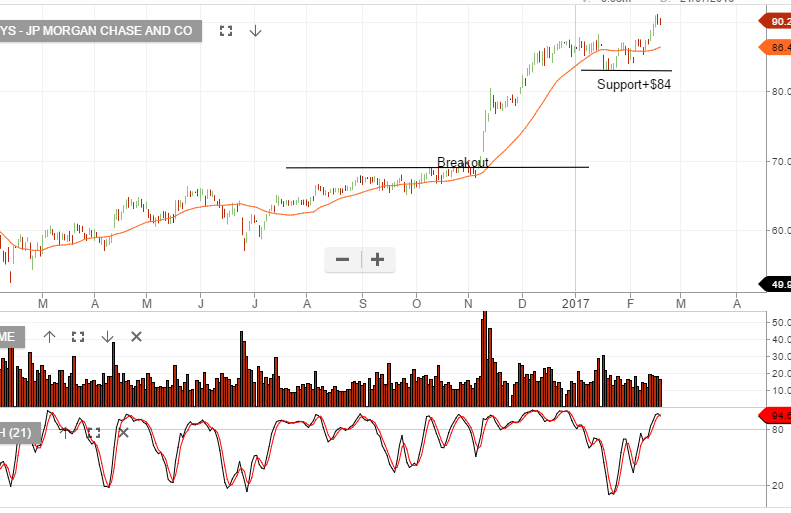
US banks, (see chart below of JP Morgan), are breaking to the upside of their recent consolidation range, and this is likely driving the rebound in the share price of the Australian banks.

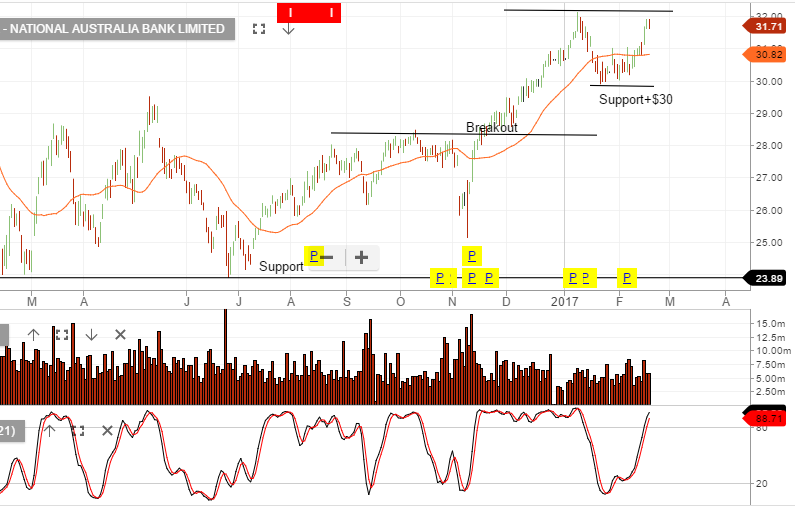
NAB reported a 1% fall in earnings following weak revenue growth and a pickup in expense growth. Bendigo Bank failed to deliver growth at the top or bottom line.

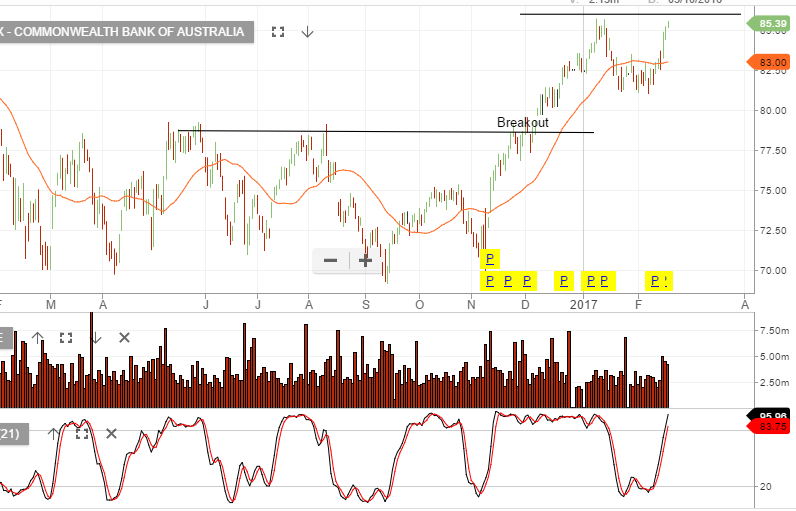
CBA reported slightly ahead of expectations with underlying profit growth of 2.8% or $4.9b for the half. ANZ’s quarterly update, (released Friday), reported a 31% rise in profits to $2b for the 3 months to December.

Across all banking results, the NIM or net interest margins, remain under pressure, as does top line revenue growth. These are the same concerns which caused the 10% sell off in banks at the start of this year.

We’ll watch with interest how prices behaves in both the XJO and our major banks this week, as we commence trading with price levels similar to the peak of early January.

Chart – CBA
Chart – ANZ
Chart – WBC
Chart – NAB
CHART – JPM


XJO – Chart Update

On the 7th of February the XJO index created a new higher low formation as buying support returned and the index rallied from the 5582 low, back to retest the trend high on Friday, when the index closed at 5805.

Currently, ASX 200 stocks which have reported, show an average revenue growth of 3.2% and underlying earnings per share growth of 6.5%. This is the first return to earnings growth in 3 years.

Chart – XJO

Sydney Airports FY16 Earnings

SYD’s FY16 results were in line with market forecasts.

EBITDA of $1.1b and DPS at $0.31. The company has flagged a
higher than expected FY17 distribution of $0.33

FY18 we assume EBITDA increasing to $1.2 billion  and based on DPS of $0.35 the stock trades on a forward yield of 5.6%.

Our preference remains TCL over SYD.

Chart – SYD


ETF UPDATE: The Aussie Dollar

The Reserve Bank of Australia (RBA) has maintained a fairly neutral bias when it comes to the value of the AUD.

That said, they also always seem to add a sentence or two in their monthly statement which describes how a higher AUD will act as a headwind to the domestic economy as it transitions to a non-mining base.

In short, it may not be an official RBA policy to engineer a lower AUD price trajectory, but it is clear that their policy goals would be much easier to achieve with the AUD/USD trading below .7000, than above .8000.

The AUD/USD has pushed through the .7700 level this week for the first time in over 3 months. The pair is struggling to sustain this potential breakout after a disappointing jobs report on Thursday.

The Australian Bureau of Statistics (ABS) announced 13,500 new jobs for the month of January, but they were all part-time positions. The participation rate slipped to 64.6% from 64.7%, which accounts for the decline in the unemployment rate to 5.7% from 5.8%.

It seems clear from these statistics that the RBA may have to ramp-up their discussions about further rate cuts to lower the AUD going into Q2 of 2017.

Technically, the AUD/USD has rallied from .7165 on January 2nd, to .7730 during yesterday’s NY session. The nearly 8% advance against the Greenback has led all the major pairs over that time.

As the corrective forces unfold, the Aussie looks vulnerable. A move back toward .7600 seems likely and a break of .7665 would signal a near-term top is in place.

BetaShares offers two Exchange Traded Funds (ETFs) which allow investors to profit from the AUD trading lower against the USD.

The USD and YANK are both traded in a unit trust structure on the ASX.

The value of the units increase as the price of the AUD/USD trades lower. The USD is unweighted, which means a 5% drop in the AUD/USD will realise a 5% increase in the unit price.

The YANK has an approximate 2.5 X times weighting, which means a 5% drop in the AUD/USD will see a gain of roughly 12.5% in the price of the shares.