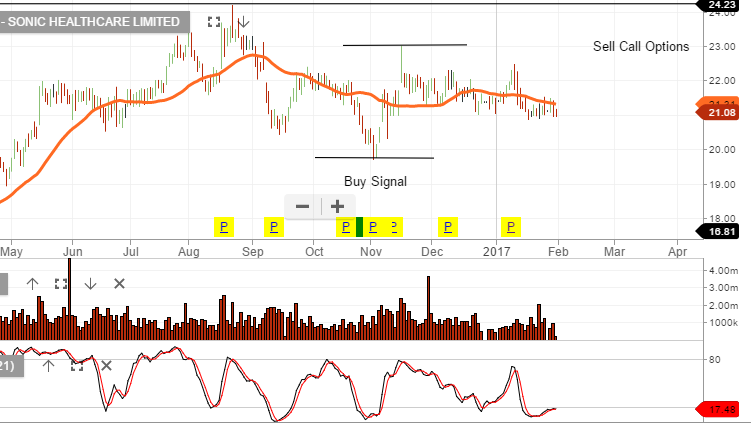
Sonic Healthcare – Buy Signal

SHL has strengthened its German footprint with the purchase of two laboratories from Medical Laboratory Bremen for A$90 million.

The deal is EPS accretive in the first year with margin expansion & synergy gains achievable in the near term.  We expect Sonic to deliver 7 – 9% EPS growth in FY17 and FY18.

FY17 revenue $5.2b, on EBIT  of $920m, Net Profit $$480m, EPS of $1.20 & DPS $0.78, places the stock on a forward yield of 3.6%.

We like Sonic as a core portfolio position, however the low yield and moderate EPS growth encourages the use of a covered call to enhance the cash flow and boost the overall investment return.

Chart – Sonic Healthcare


SP 500 Technical Picture

The SP 500 index is at a critical juncture based on two technical price indicators. The daily chart shows that the 30-day moving average (2265.00) has now converged closely to the Daily Parabolic switch point (2263). The low of the day in the SP 500 futures today was 2263.25.

The significance of this convergence is that it often time signals a change in medium-term directional momentum. In this case, the SP 500 hasn’t posted a close below the 30-day moving average since November 7th at 2130.00.

Considering how the SP 500 price has now extended beyond forward expectations of inflation and 12-month EPS levels, a decisive break of 2263.00 will likely trigger range extension to the downside. The December 30th low of 2225.00 is the first level of downside support.

US Markets – Dow Jones Index Leaders

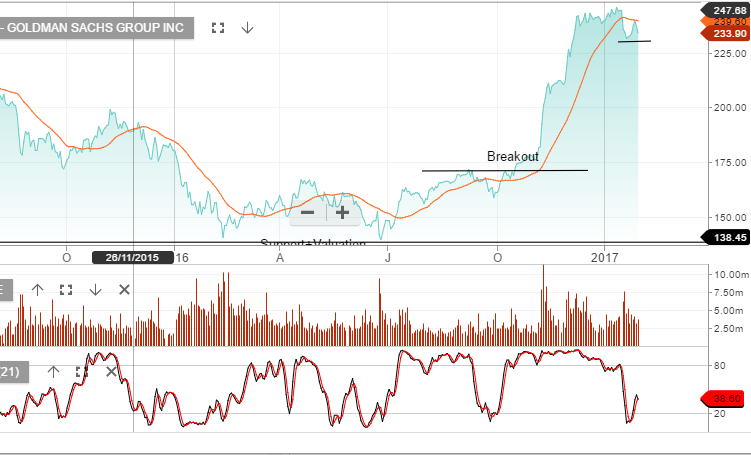
Goldman Sachs was down 2.5% overnight and was among the worst performers within the Dow Jones index of 30 companies. We see support at $230 and resistance at $245. As a gauge to the likely direction of US financials over the March quarter, we think it’s worth keeping an eye on the directional break of Goldman Sachs trading range.

Chart – Goldman Sachs

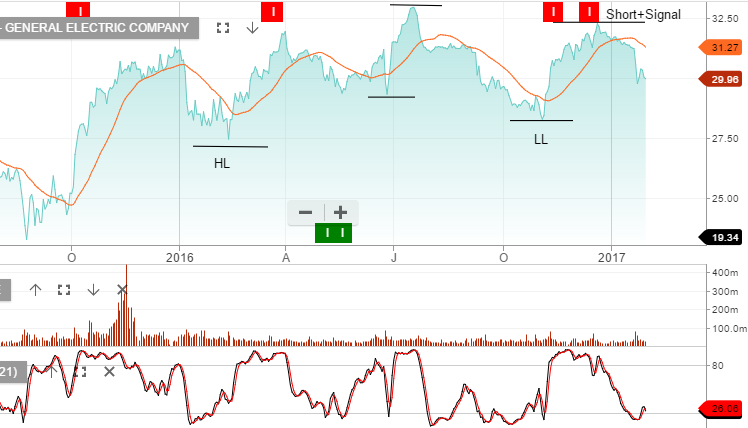
We’re also watching the negative lead from General Electric as the stock trades 10% below the recent high formed on the 20th of December.

Chart – GE

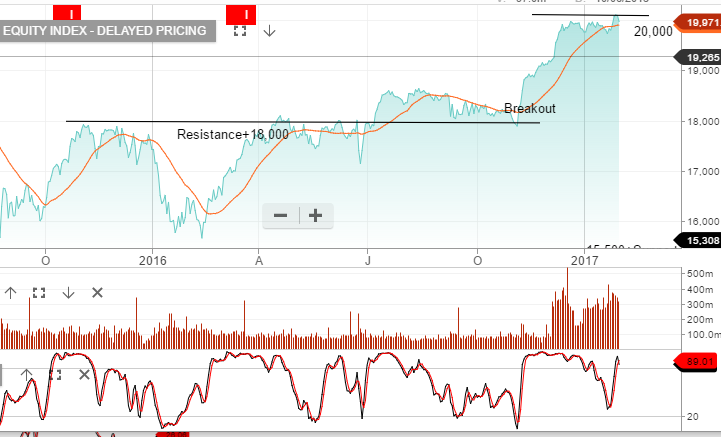
S&P500 earnings need to grow by 10 – 12% over the next 12 months to support the Dow Jones at 20,000. If average EPS tracks at the same rate achieved in 2014, 2015 & 2016, of approximately $120 per share, an argument could be made that the true value for the Dow Jones sits back at 16,500 to 18,000.

Chart – Dow Jones

AGL Outlook

Several market commentators have focused on AGL as an Utility Stock ready to make a strong move higher; we aren’t as confident.

While the AGL stock price has rallied over 25% during the last 12 months, the source of these continued gains are based on increased earning expectations as the increase in electricity costs roll through to both consumers and business users.

Further, AGL bulls are relying upon improved fundamentals within the electricity market to support elevated prices.

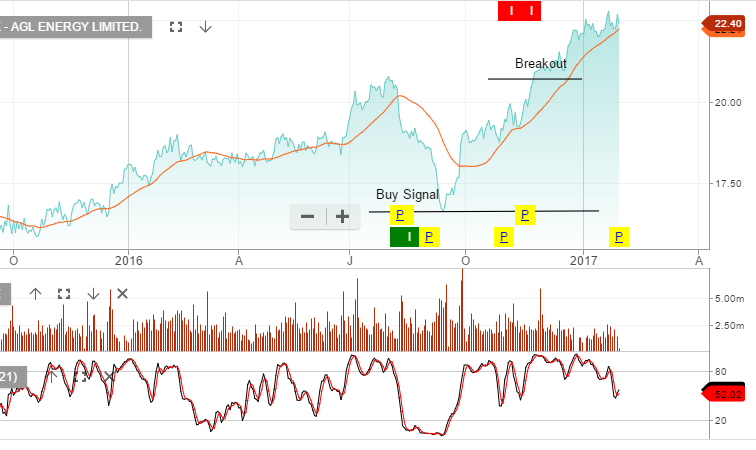
Our view is that the expected jump in earnings and dividends per share will be hard to attain and that a sideways trading pattern between $20.00 and $22.50 is a more likely outcome over the medium-term.

Chart – AGL

QBE Higher On Merger Talks

Shares of QBE have jumped over 5% in early trade, posting a new 15-month high of 12.97, on rumors that the firm was in formal merger talks with insurance giant Allianz.

According to an article in a German newspaper, the CEO’s of the two companies met before Christmas and Allianz made an informal offer of $15.00 per share for QBE.

This offer price represents a 20% premium to QBE’s closing price on Friday. Aside from this merger rumor, the stock has had a steady increase since early November as US bond yields have move higher.

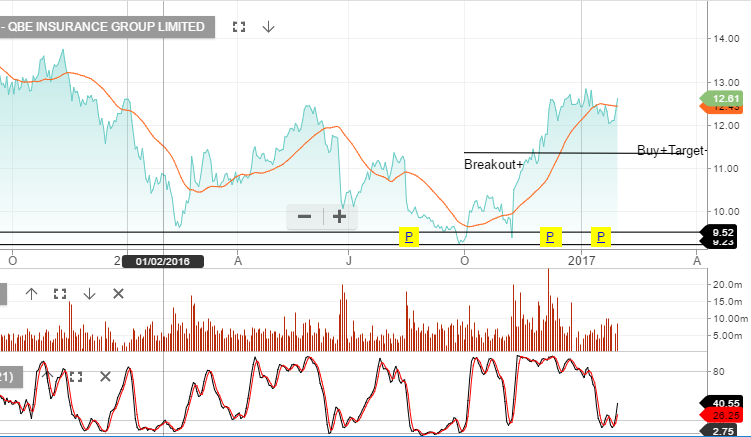
Without any further clarification about the merger talks, we would expect technical resistance to be seen in the  $13.25 area.

Chart – QBE

US Gross Domestic Product (GDP)

US Gross Domestic Product (GDP) for the forth quarter of 2016 came in at 1.9%, reinforcing the stagnation in the US economy.

The December quarter GDP is the fifth out of the past six quarters where GDP has come in under 2%. This may help to explain why US companies are struggling to grow top line revenue.

We’re about two thirds through the reporting season for S&P500 companies, so far earnings appear to be growing at around 6%, which is 50% below the markets bullish expectations for 2017.

Looking ahead, we remain cautious of both the March GDP reading and in particular, the S&P500 March quarter earnings, (reported in April).

An area of concern when we get to the March numbers will be the US financials. The large jump in earnings among leading US trading firms in the December quarter from bond trading, will unlikely be repeatable in the March numbers.

Bond volatility in the March quarter will probably be less than December, therefore, resulting in lower levels of trading income. Furthermore, we’re beginning to see signs that mortgage repricing is starting to negatively impact housing starts. This was evident in the December new home starts data, which showed a 10% fall.

Correlation – USD & US 10-year yield

With the USD struggling to move higher as 10-year bond yields move back over 2.50%, some market commentators are calling the USD rally over. We don’t necessarily agree with that assessment but we do recognize that the USD/10-year yield correlation has changed.

The first few days of the Trump administration has been received by the FX market with a mix of relief and fatigue. The lack of follow through on his more aggressive campaign proposals in the area of international trade has been a source of relief.

At the same time, the FX market has traded in a less sensitive pattern to the lack of consistency amongst the views of top administration officials with regard to the USD policy. The net result of the mix of fatigue and relief has been a broad unwinding of bullish USD positions  and higher volatility across the major FX pairs.

Although the USD policy hasn’t been discussed directly, it seems the new administration is willing to talk the USD down. This lingering political risk in the USD has seen a rapid breakdown in the percentage correlation between the USD and 10-year yields. 

On November 1st, the directional correlation between the USD and the US 10-year yield was 93%. This means that the USD was moving higher as US yields moved higher on a 93% correlation. However, as of this Tuesday, this correlation has dropped to just under 50%.

It’s difficult to determine how long this condition might last. Considering  two of the biggest current drivers in the FX market are policy comments from the new administration (which aren’t scheduled) and the steady increase in US equity prices, which seem to be moving further into over-valued territory.

It seems reasonable to expect in the near-term that US equity prices will correct from the recent all-time highs and 10-year yields to find some resistance in the 2.60% area. In this case, the directional impact in the USD would be a bit clearer to map. In general, when the market moves into a “risk-off” phase, the USD will firm against all G-7 pairs except the JPY.

The two key data points in the US today will be the Durable Good orders and Advanced GDP. Both of these data sets have the potential to rattle the market if they print wide of expectations. Between the two, we believe the risk with the GDP number is asymmetrical to the downside. In other words, the “risk-off” trade will be greater on a weaker print than the “risk-on” impact of as better report.
ASX200 – XJO Technical Review

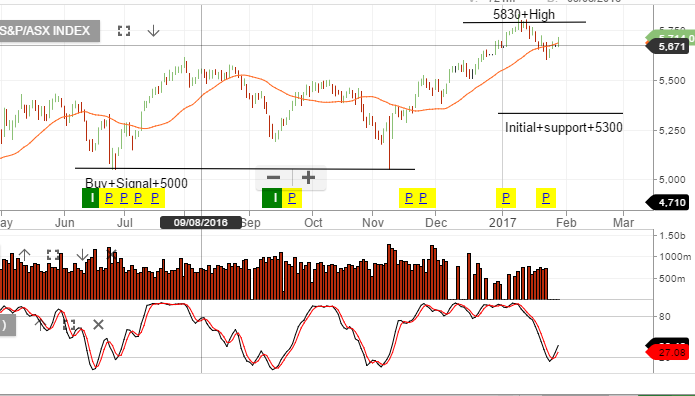
The XJO has bounced off Monday’s low of 5600 points. A combination of the US indices trading modestly higher and the short term oversold conditions in the Australian banks, lead to the minor rally in the XJO. However, with relatively weak top line revenue growth in the US, we still remain cautious on the expected price action in the week ahead.

A break above 5830 will be bullish and a rollover in price around 5750 followed by a later break of the 5600 support will be quite negative.

Chart – XJO


Colgate Shares Post 1-Year Low On Weak Guidance

Shares in Colgate-Palmolive had their biggest one-day drop since July 2010 on weak Q4 sales and negative forward guidance for low growth in 2017.

The company reported Q4 EPS of 68 cents per share on net income of $606 million compared to estimates of 75 cents per share.

Company sales were reported at $3.72 billion, below the year-ago number of $3.89 billion, and below the street’s estimate for Q4 sales of $3.9 billion.

The worst part of the report was the announcement that the company expects 2017 EPS to be flat and in the low single digits on an adjusted EPS basis.

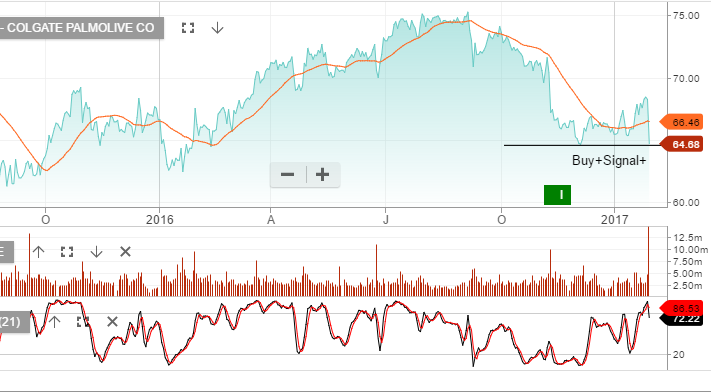
Our Algo Engine generated a buy signal at or near the recent $65 low and with the weakness in the overnight earnings result, we recommend running a stop-loss on a break below 63.50

Chart – Colgate


A Big Q4 Miss For Chevron

Shares of Chevron lost over 2% today to $113.80 as the energy giant reported Q4 earnings results which missed estimates by a wide margin.

The company announced Q4 EPS of 22 cents per share, on revenue of $31.5 billion. Analysts had expected the firm to report EPS of 64 cents per share on revenue of $33.3 billion.

In the year-ago period, Chevron reported a loss of $588 million, or 31 cents per share just as crude oil prices were hitting a 12-year low near $27.00.

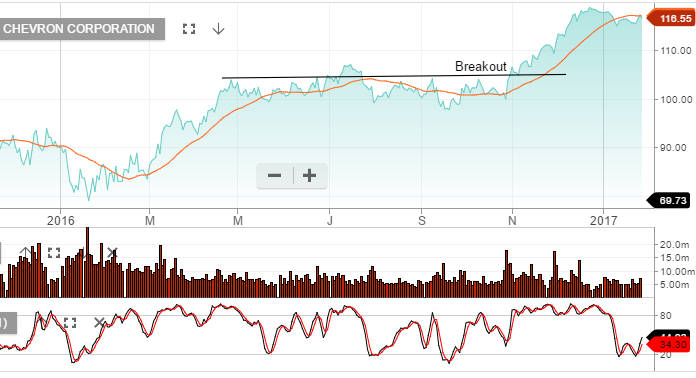
We expect Chevron’s share price to closely track the price of crude oil going forward, and would look for the next area of support to be near the November price breakout range of $105

Chart – Chevron