AMP
AMP
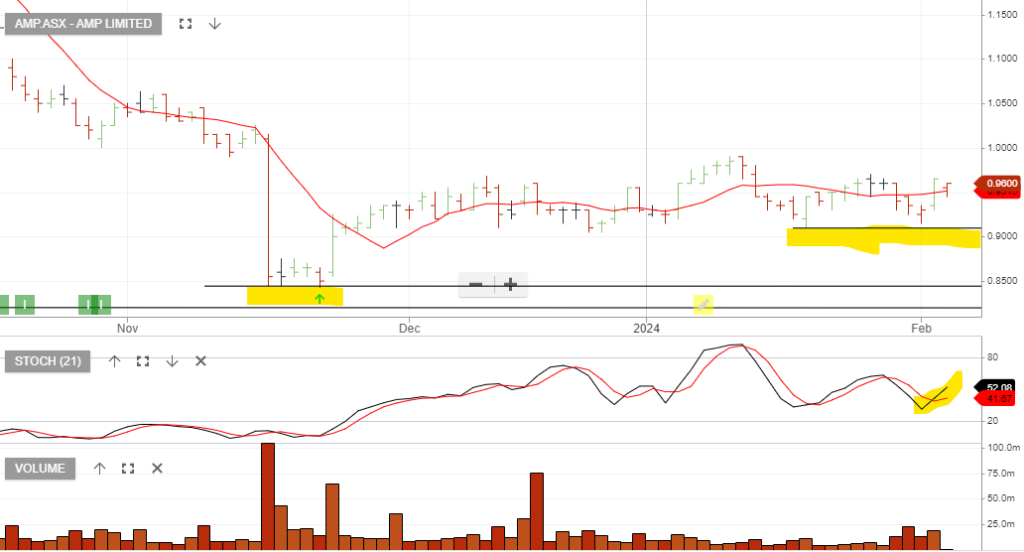
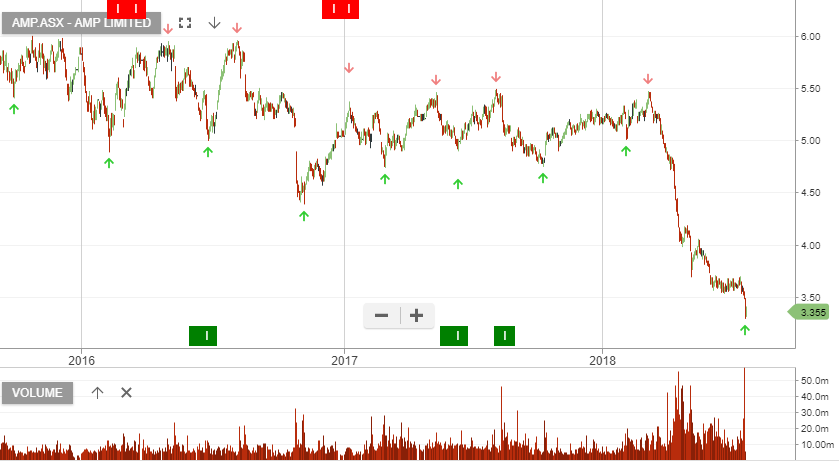
AMP has built a higher low formation with support at $0.91.
AMP
AMP is a current holding in our Trade Table.
AMP’s 1H18 Result
AMP’s 1H18 result was underpinned by effective cost management offsetting
weaker revenue performance.
The Australian Wealth Management division saw net outflows of $673m in the quarter.
Going forward, we expect well managed costs to offset weaker revenue. There is longer-term value here for patient investors, who are willing to hold the stock through to the appointment of a new permanent CEO.
In 2019, AMP’s board will likely outline a plan to split the funds management business away from the traditional advice side model, unlocking value for shareholders.
We have AMP now trading on a 6.8% yield and expect FY19 reported profit to remain around $800m.
AMP
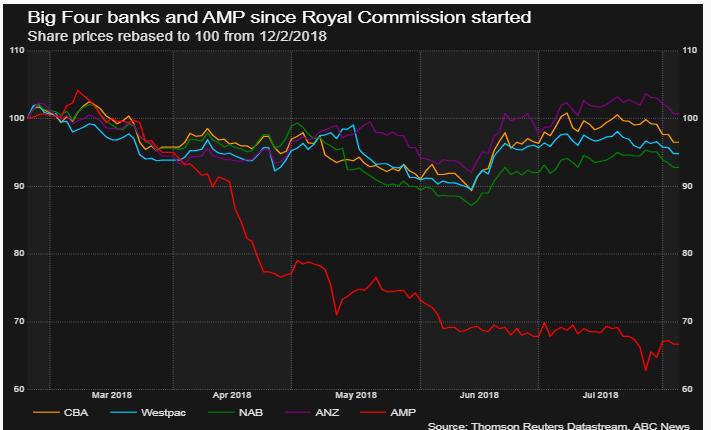
Banks Brace For Round 5 Of The Royal Commission
The Big four banks will be in the spotlight this week as the Banking Royal Commission commences round five today in Sydney.
The main topic for this round of examination will be the fees, charges and weak performance of bank-managed superannuation funds.
One Melbourne-based think tank has estimated that excessive fees and poor performance can cost superannuation investors up to $12 billion per year.
Australia’s largest superannuation provider, AMP, felt the wrath of the Royal commission during the last round of testimony, which saw their share price drop over 30% and the sacking of its chairman, CEO and three other directors.
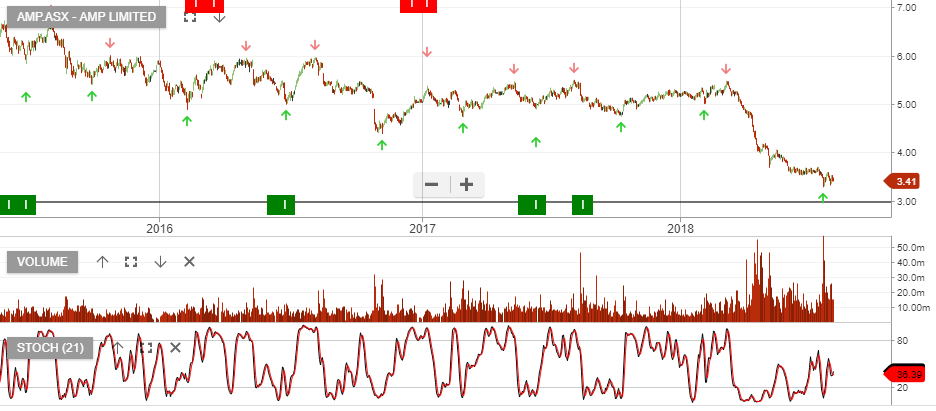
The chart below illustrates the performance of AMP’s share price relative to the other Big 4 banks.
We don’t have ALGO buy signals for any of the domestic banks and we’re not holding any banking names in our ASX Top 100 portfolio. However, we will look for signals as the share prices approach the June lows.
AMP – 1H18 warning
AMP will need to address a wide range of issues including the Royal Commission responses, grandfathering and impact of Budget proposals in order for investors to understand AMP’s sustainable level of profitability.
Investors are also looking for the CEO to outline the longer-term group strategy. With many anticapiting some sort of restructure and the separation of the funds management business away from the advice model.
1H18E profit guidance came in lower than consensus expectations at $490-$500 million.
AMP is the worst performing stock in the ASX 50 model.
We have two under performing stocks, AMP and FMG. Both businesses face unique structural issues that have weighed on their respective share prices.
We feel investors will be rewarded for slowly accumulating AMP shares at discounted levels but it is very difficult to see when the inflection point occurs.
AMP goes ex div $0.145 on 23rd August and we have the stock trading on a forward yield of 7%.
AMP
AMP Continues to Grind Higher
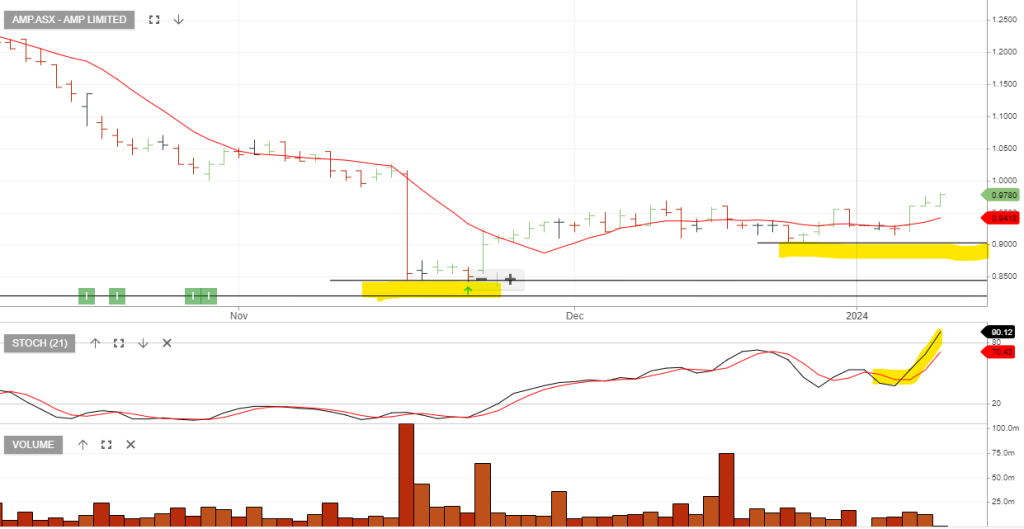
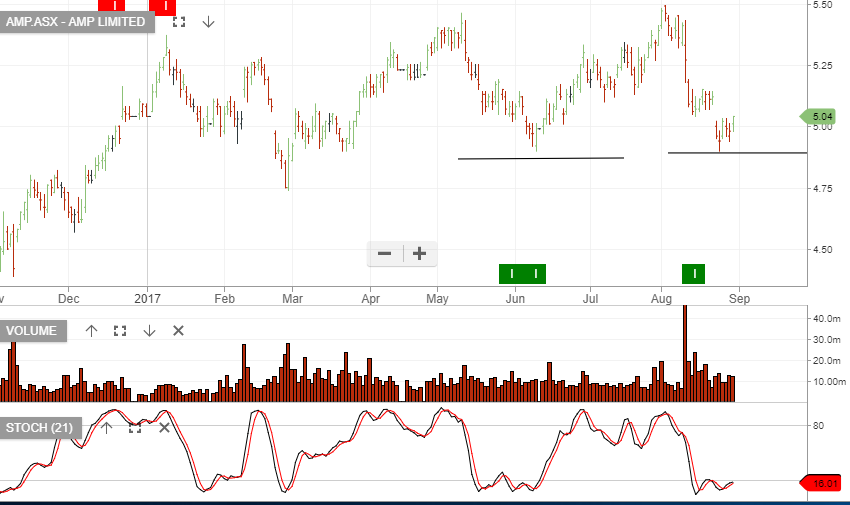
AMP continues to trade higher as the price action builds on the “higher high & higher low” formation.
AMP was added into the ASX50 model in June at $5.00. Our upside target for the stock is $5.40 – $5.50.
AMP
Algo Buy Signal – AMP
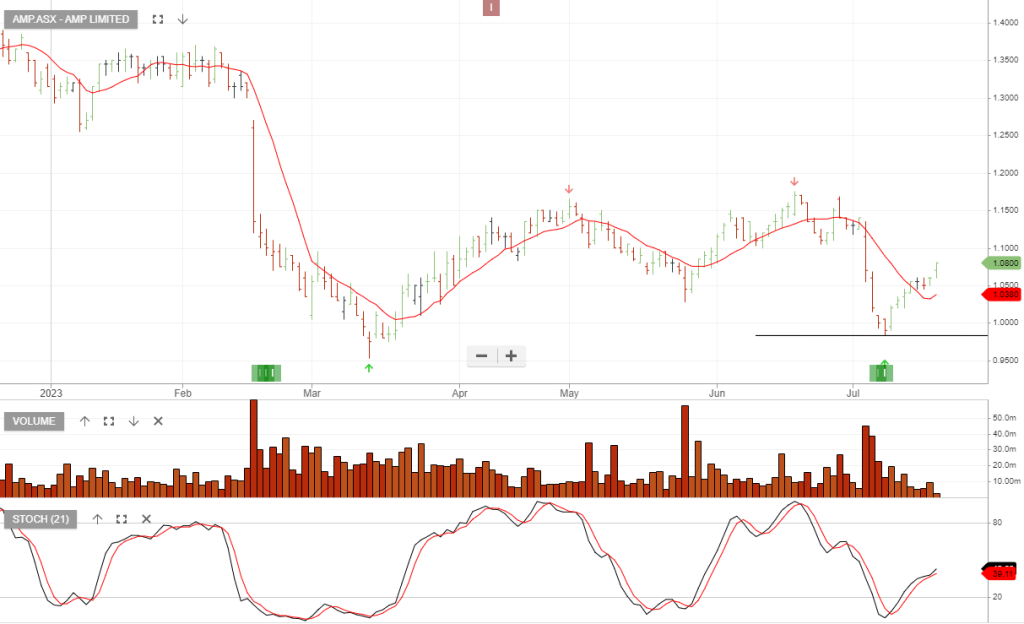
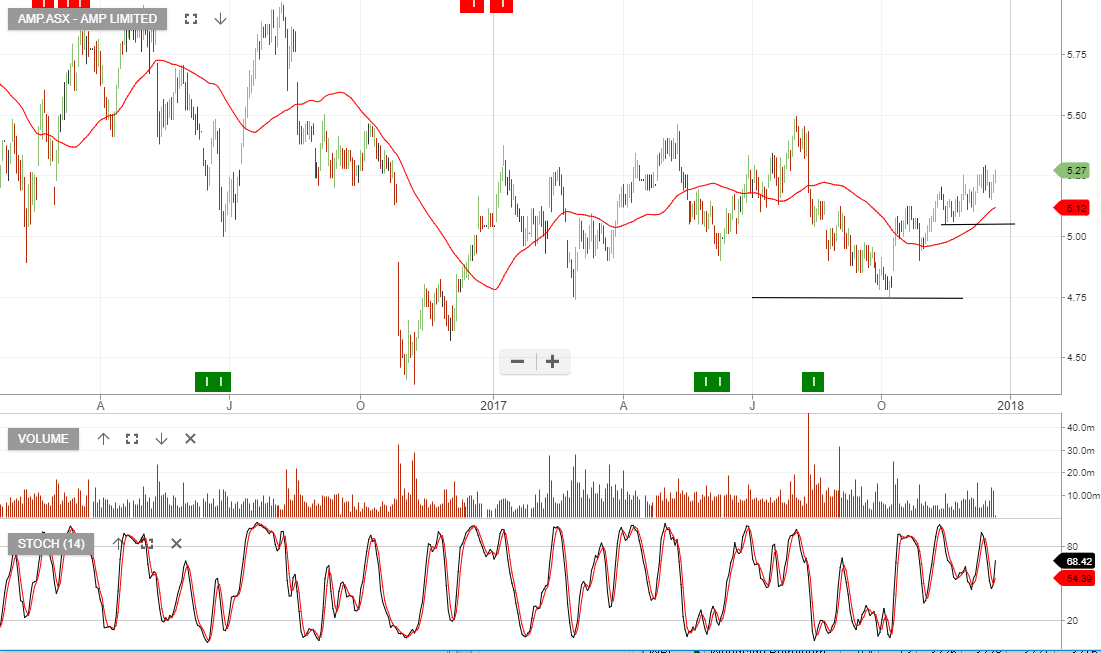
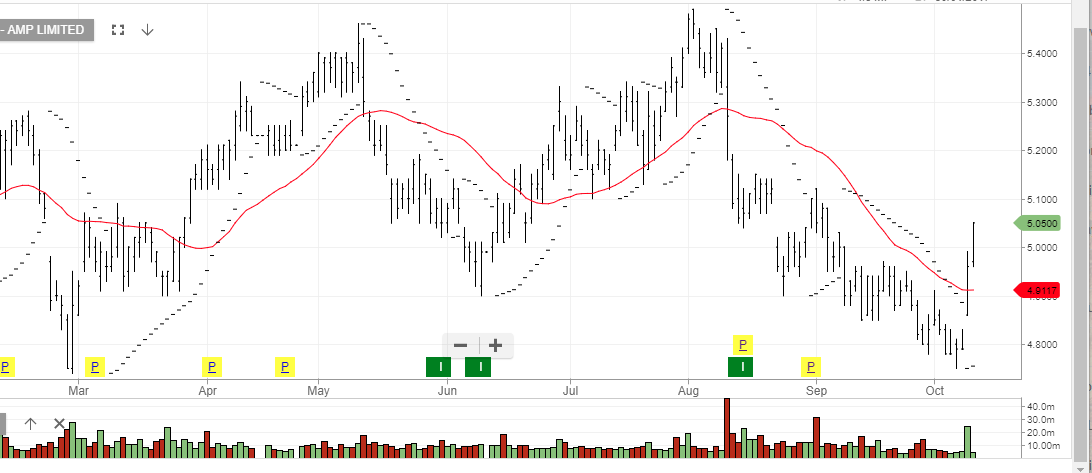
Our Algo Engine generated a recent buy signal in AMP.
With the price action finding support at $4.75 and now trading into the $5.15 range, we continue to see upside momentum.
AMP looks well positioned to benefit from domestic trends in mandated super and search for yield in infrastructure & property.
AMP is currently in our ASX 20 and ASX 50 model portfolios.
AMP
ALGO UPDATE: AMP Is Approaching Resistance
One of Australia’s largest money managers, AMP, has caved in on the pressure from index and computerized trading and has dropped their fees, and is looking to sack most of their active equity managers.
The bulk of the $29 billion in funds the firm now manages will be rolled into lower-cost strategies including existing quantitative funds within AMP Capital.
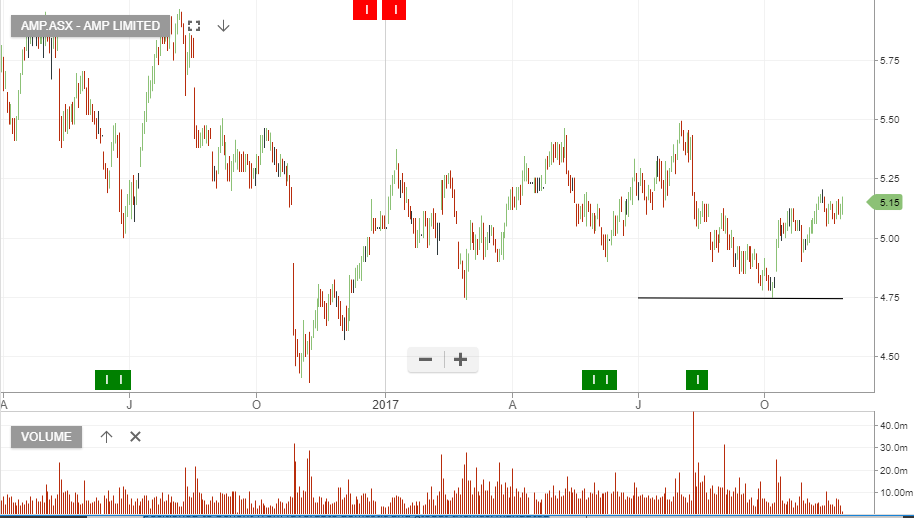
Our ALGO engine triggered a buy signal for AMP at $4.80 on August 21st.
We see key chart resistance in the $5.25 area and would look to exit long positions at, or near, that level.
AMP
Algo Buy Signal – AMP & SUN
We continue to take a very cautious approach to the market, especially when we look at potential negative events over the next 8 weeks. Also, realizing that we approach this juncture at peak valuations for many global equity markets.
With the above in mind, Investors could be forgiven for wanting to sit on the sideline or only hold the highest of quality names. Traders on the other hand, will continue to remain active and apply stop-losses as a way of mitigating risk.
The Algo Engine has recently flagged buy signals in AMP and SUN. Both of these are reasonable prospects for a bounce from the oversold conditions, although stop losses should be established below the recent pivot point.

Level 17 Chifley Tower
2 Chifley Square
Sydney, NSW 2000
1300 614 002
Investor Signals Pty Ltd
ABN 44 143 555 453