Purpose: NEAR is a decentralized application (dApp) platform designed to make blockchain-based apps user-friendly.
AI Relevance: NEAR supports AI integration for scalable and efficient dApps, enabling machine learning and data-driven applications in decentralized environments.
2. Artificial Superintelligence Alliance (FET)
Purpose: The Fetch.ai (FET) platform focuses on creating decentralized AI solutions using blockchain for automation and optimization.
AI Relevance: Fetch.ai enables autonomous agents powered by AI to perform tasks like supply chain optimization, smart city infrastructure, and decentralized marketplaces.
3. BitTensor (TAO)
Purpose: BitTensor is a decentralized machine learning network where users can share and trade AI models.
AI Relevance: It incentivizes AI developers to contribute and improve the network’s collective intelligence through a blockchain-based token economy.
4. Render (RNDR)
Purpose: Render is a decentralized GPU rendering network that provides computational power for graphics and AI workloads.
AI Relevance: It supports rendering AI-driven visualizations and simulations by enabling access to GPU resources on the blockchain.
5. The Graph (GRT)
Purpose: The Graph is an indexing protocol that enables efficient querying of blockchain data.
AI Relevance: Its indexing services are used by AI and machine learning projects to quickly retrieve structured blockchain data for training and analytics.
6. Virtuals Protocol (VIRTUAL)
Purpose: Virtuals Protocol is focused on decentralized metaverse and AI technologies.
AI Relevance: It provides AI-powered tools to enhance virtual environments, including digital identities and autonomous avatars.
7. AIOZ Network (AIOZ)
Purpose: AIOZ is a decentralized content delivery network (CDN) that leverages blockchain for efficient media delivery.
AI Relevance: AI is used within the network to optimize content distribution and enhance streaming quality for end-users.
8. Akash Network (AKT)
Purpose: Akash Network is a decentralized cloud computing platform that offers flexible and cost-effective computation.
AI Relevance: It provides infrastructure for running AI workloads, machine learning models, and other resource-intensive processes.
9. Grass (GRASS)
Purpose: Grass focuses on decentralized AI services, offering solutions for digital resource management and automation.
AI Relevance: It supports the deployment and monetization of AI algorithms and tools for various applications like agriculture and automation.
10. Arkham (ARKM)
Purpose: Arkham is a blockchain intelligence platform that specializes in on-chain data analytics.
AI Relevance: It uses AI to track and analyze blockchain transactions, providing insights into market movements and financial patterns.
These projects represent a convergence of AI and blockchain technologies, addressing a variety of use cases, from decentralized computing to AI-powered analytics and automation. Let me know if you’d like a deeper dive into any specific coin!
Best Overall Technology
If we consider AI-specific technology, BitTensor (TAO) stands out for its unique approach to incentivized AI model collaboration, which is foundational for decentralized AI ecosystems.
For general-purpose AI and blockchain integration, Fetch.ai (FET) leads with its versatility and real-world use cases.
For infrastructure and scalability, Akash Network (AKT) and NEAR Protocol (NEAR) are highly robust, depending on whether you prioritize computing or dApp development.
Key Insights from the Table
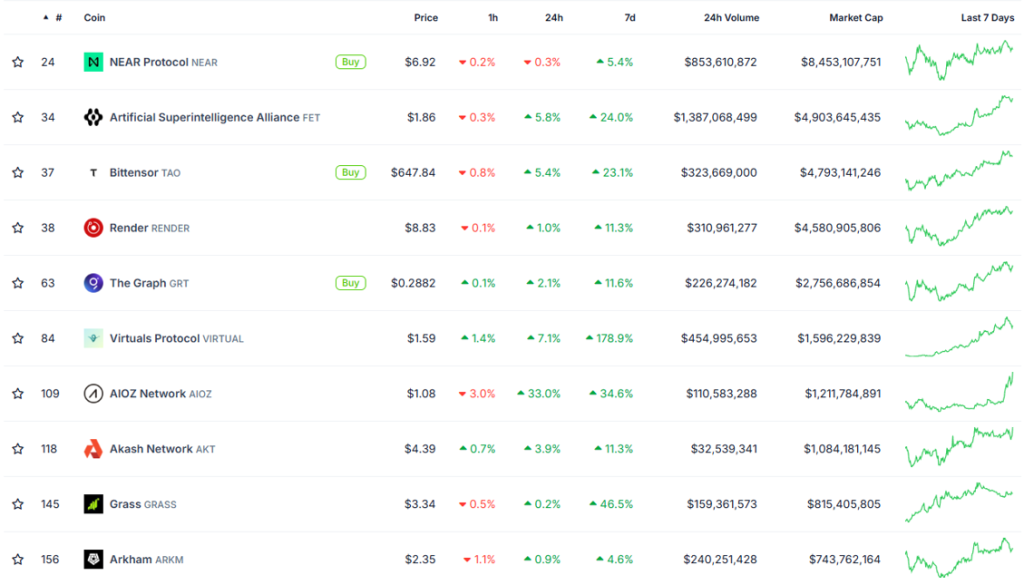
BitTensor (TAO): $4.79 billion.
24-Hour Trading Volume: A high trading volume indicates strong investor activity.
Fetch.ai (FET): $1.387 billion (highest trading volume among the coins in the list).
NEAR Protocol (NEAR): $853 million (second-highest).
Virtuals Protocol (VIRTUAL): $454 million.
7-Day Price Change: Significant price gains over 7 days indicate growing investor demand.
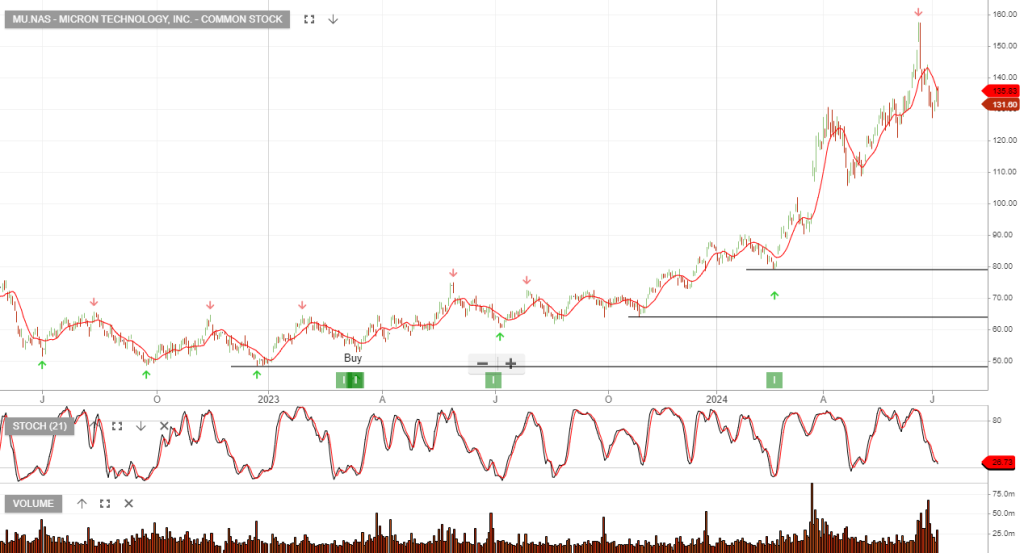
MU:NAS was added to our model portfolio in March 2023 at $56 and is now up 134%. We recommend watching for the next Algo Engine buy signal.
Micron reported 50% sequential data center revenue growth in Q3, driven by AI demand. The company is well-positioned to benefit from the CHIPS Act and plans to expand its manufacturing.
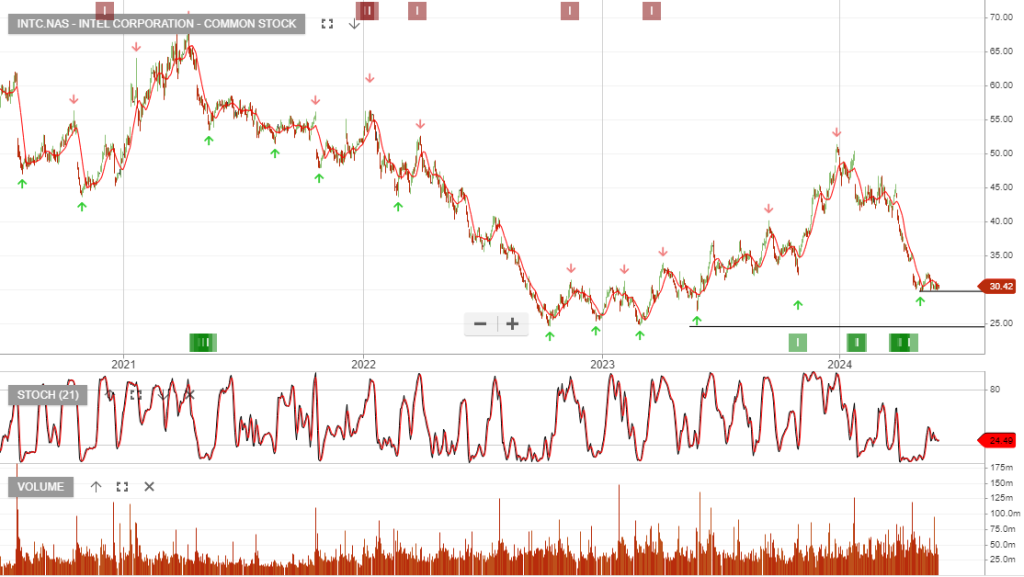
The launch of Intel’s Gaudi 3 AI accelerator and the reorganization of its foundry business are positive signs for future growth. During the first quarter, Intel’s revenues increased by 8.5% Y/Y to $12.7 billion.
The launch of Intel’s Gaudi® 3 AI accelerator in Q3, which appears to be more powerful than NVIDIA’s flagship H100 GPU, should also help the company improve the performance of its data center business, revenue to total $56 bln (+3% y/y) in 2024, and jump to $65.3 bln (+17% y/y) in 2025. Adjusted EBITDA is set to total $13.8 bln (+7% y/y) in 2024, and rocket to $20.3 bln (+47% y/y).
Intel’s revenue structure
Effective from 1Q 2024, the company modified its segment reporting, with revenue now coming from the following business units:
1. Intel Products
Client Computing Group (CCG)
Data Center and AI (DCAI)
Network and Edge (NEX)
2. Intel Foundry
Intel Foundry Services (IFS)
3. All other
Altera
Mobileye
Other
Client Computing Group(CCG) – this segment generates about half of the company’s revenue. It supplies central processing units for desktop PCs and notebooks.
Data Center and AI (DCAI) – The key products in this segment are CPUs, GPUs and Gaudi AI accelerators.This segment has accounted for just under 30% of the company’s total revenue in recent years
Intel’s revenue structure: Intel Foundry
Intel Foundry – the segment that includes chip manufacturing for Intel’s own needs as well as for external customers. Intel entered the market of contract manufacturing of semiconductors in 2021 as Intel Foundry Service (IFS) to capitalize on the growing demand for foundry capacity. To provide transparency in the segment’s operations, the company in its reporting separates revenue generated from external customers and revenue from inter-segment sales within Intel. As of the end of 2023, revenue from external customers totaled $953 mln (+96% y/y), or 5% of total IFS revenue of $18.9 bln (-31% y/y).
Even though IFS revenue from external customers is relatively small, Intel has ambitious plans to expand the plants by investing its own funds and with the help of government subsidies (Under the CHIPS Act the US government has given Intel $8.5 bln in grants and the option to draw $11 bln in federal loans).
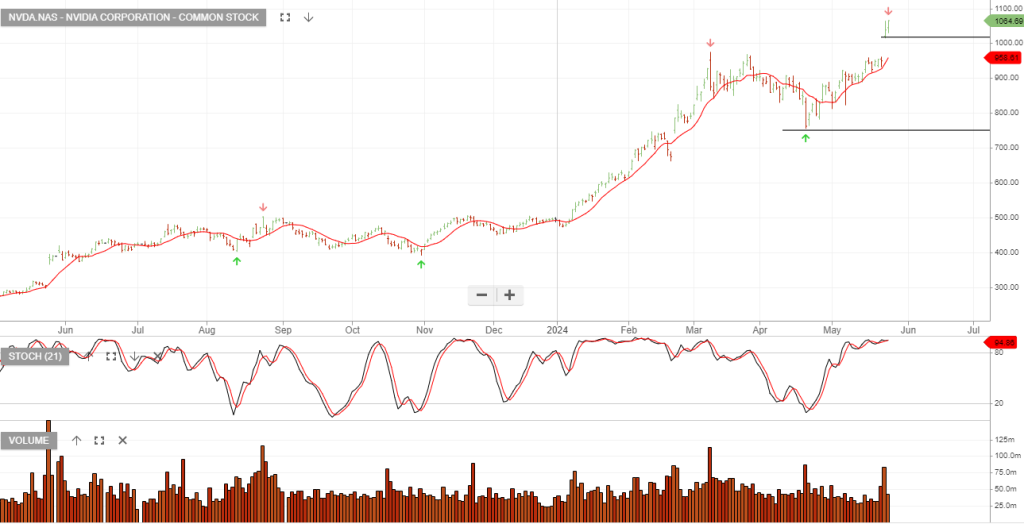
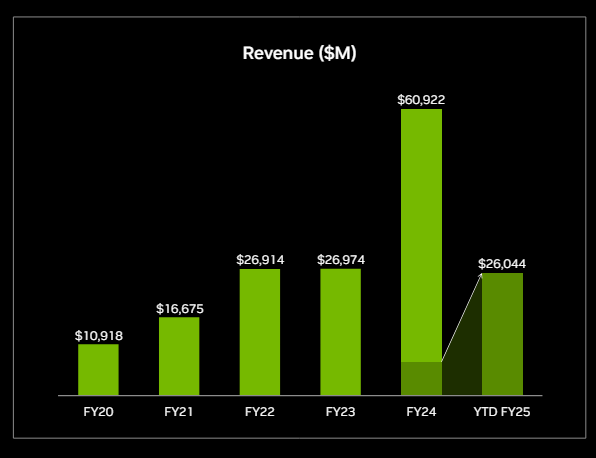
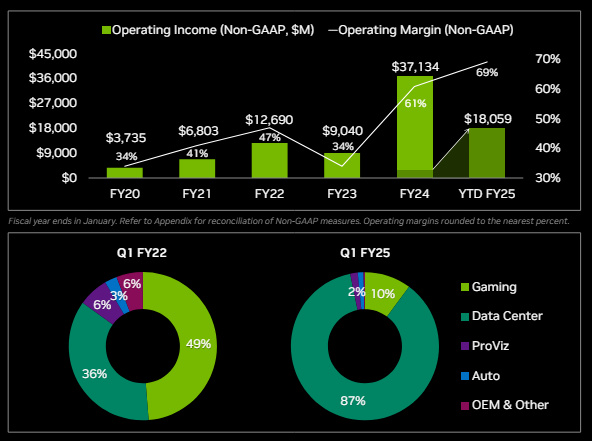
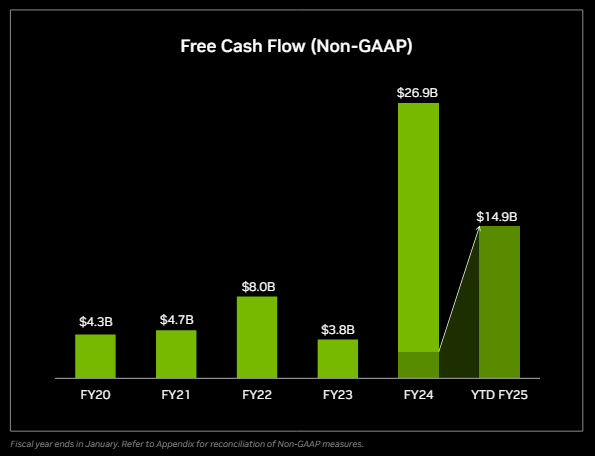
NVIDIA Corporation – Common Q1 earnings produced record revenues and profits as the Data Center business continued to grow rapidly. The company announced a ten-for-one stock split. Nvidia shares are now trading at 40x forward earnings.
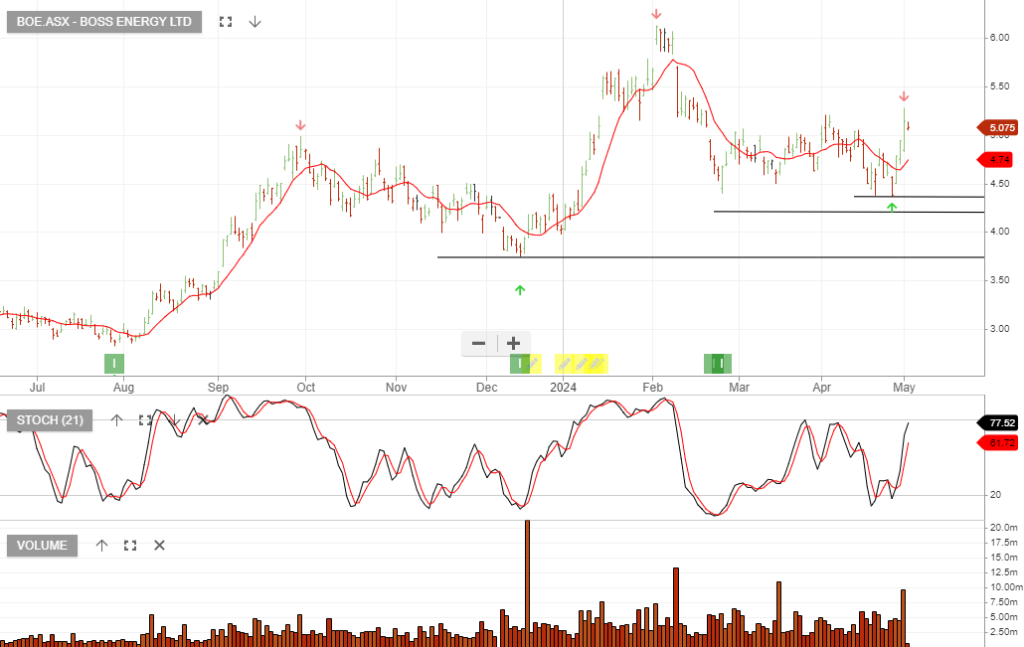
ASX:BOS announced the first uranium in the drum at the Honeymoon project, with production to commence from Alta Mesa in May. Strong uranium prices also support the share price.
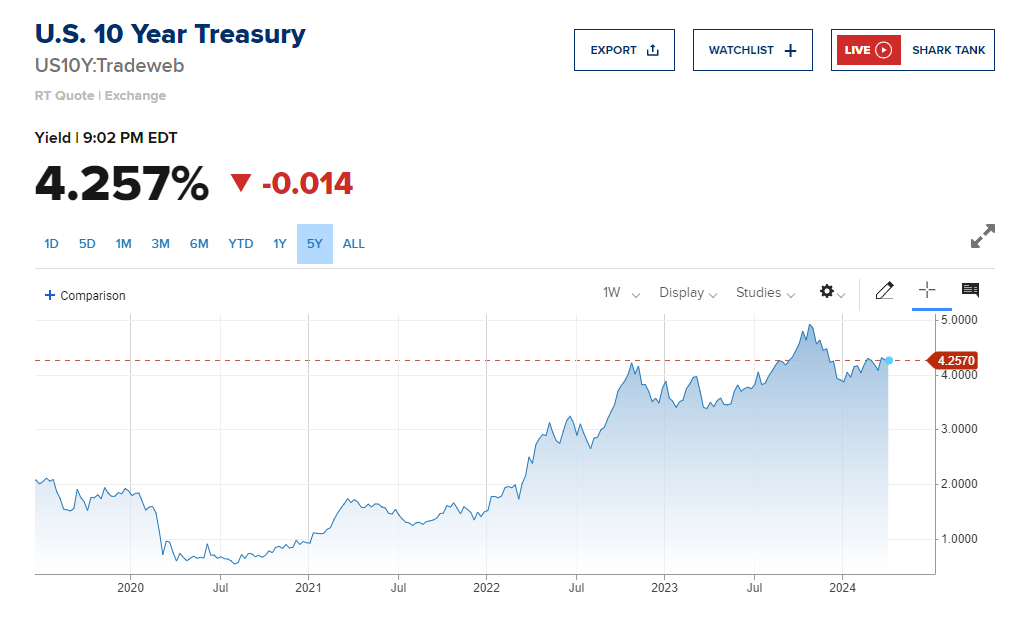
The Fed kept rates on hold between 5.0% and 5.25%, in-line with market expectations. As for Powell’s commentary, here are some of his key comments:
Rate outlook: “We are prepared to maintain the current target range for longer if appropriate … If the economy evolves going forward, the appropriate level of the federal funds rate will be 4.6% at the end of this year, 3.9% at the end of 2025 and 3.1% at the end of 2026.”
Rate outlook: “We believe that our policy rate is likely at its peak for this time in the cycle.
Overall – The Fed still seeks greater confidence inflation is moving sustainably down before making its first rate cut.
Sophisticated Investor?
We have special opportunities available for Sophisticated Investors. If you're interested, and qualify, please provide your details below.