Inner Circle

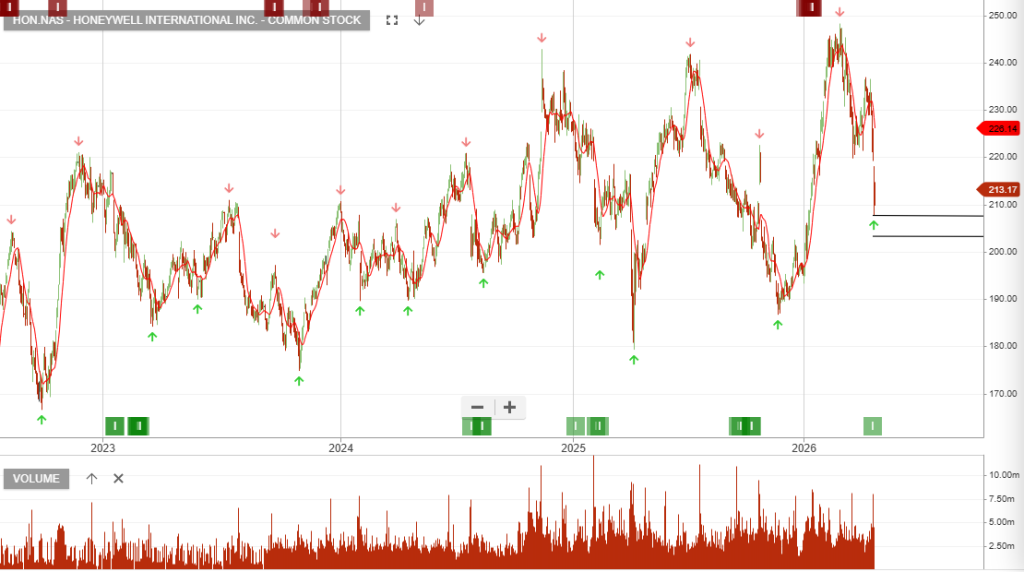
Honeywell International Inc. – Common is currently a “transformation play.” While near-term revenue headwinds and supply chain issues are weighing on the stock, the June 29 Aerospace spin-off is the primary catalyst we’re watching.

Q1 2026 Earnings Highlights (Released April 23, 2026)
Honeywell reported mixed results for the first quarter of 2026:

  • Adjusted EPS: $2.45, beating the analyst consensus of $2.32 (up 11% year-over-year).
  • Revenue: $9.14 billion, missing the estimated $9.30 billion. Organic sales growth was 2%, slowed by mechanical supply chain constraints in Aerospace and geopolitical disruptions in the Middle East.
  • Margins: Segment margins expanded 90 basis points to 23.3%, driven by strong pricing discipline and cost removals.
  • Backlog: Rose 15% to a robust $38 billion, indicating strong future demand.

Strategic Catalyst: The Aerospace Spin-Off
The biggest upcoming driver for HON is the planned separation of its Aerospace business:

  • Spin-Off Date: Scheduled for June 29, 2026.
  • Objective: To create two “pure-play” companies: one focused on Aerospace Technologies and the other (RemainCo) on Industrial/Building Automation and Energy.
  • Divestitures: Honeywell also recently announced the sale of its Warehouse and Workflow Solutions (WWS) and Productivity Solutions and Services (PSS) businesses, expected to close in the second half of 2026.

Fundamental Metrics & Valuation

  • Price-to-Earnings (P/E) Ratio: ~26.5x (Trailing).
  • Forward P/E: ~19.6x.
  • Dividend Yield: ~2.27% ($4.76 annualized).
  • Full-Year 2026 Guidance:

* Sales: $38.8B – $39.8B (3-6% organic growth).
* Adjusted EPS: $10.35 – $10.65.
* Free Cash Flow: $5.3B – $5.6B.

Analyst Outlook

  • Consensus: “Moderate Buy” with 13 Buy ratings and 8 Hold ratings.
  • Price Targets: Analysts have a median target of $245.00 – $250.21, implying a potential upside of roughly 15-20% from current levels.
  • Recent Changes: Following the revenue miss, firms like Citigroup and Barclays slightly lowered their price targets (e.g., Citi from $265 to $257) but maintained “Buy/Overweight” ratings, citing long-term value in the portfolio breakup.

Intuitive Surgical

{NAS.ISRG} is a dominant leader in the robotic-assisted surgery market, known for its da Vinci surgical systems.

Earnings Alert: Q1 2026

  • Release Date: Tomorrow, April 21, 2026, after market close.
  • Estimates: Analysts expect EPS of approximately $2.08 – $2.16 on revenue of $2.61 – $2.67 billion.

Key Focus: Investors will be watching for updates on the rollout of the da Vinci 5* and commentary on 2026 procedure growth guidance (currently 13–15%).

Fundamental Metrics

  • Market Cap: ~$166.65 Billion.
  • Valuation:

* Forward P/E: 41.06x
* Trailing P/E: 59.54x
* Price-to-Book: 9.35x

  • Analyst Sentiment: Rated as a Buy (Average Rating: 1.9) with a median price target generally cited near $600, implying significant potential upside from current levels.

Recent Developments & Catalysts
FDA Expansions: In early 2026, the company received FDA clearance for the da Vinci 5for select cardiac procedures and recently expanded da Vinci SP* indications to include inguinal hernia and appendectomy.

  • Operational Milestone: The company reached a milestone of 20 million procedures performed globally in January 2026, reinforcing its massive “razor-and-blade” recurring revenue model (instruments and accessories).
  • Guidance Caution: The stock has seen some pressure in early 2026 due to conservative procedure growth guidance (13-15% vs. 18% in 2025), as the company laps tough year-over-year comparisons.

Performance Context

  • 52-Week Range: $427.84 – $603.88.
  • Technical Trend: The stock is currently trading below its 200-day moving average ($503.09), suggesting it is in a period of consolidation or correction ahead of its earnings results. It has underperformed the broader S&P 500 YTD by approximately 18%.

Actionable Insight: ISRG remains a high-quality growth play, but current valuation multiples reflect high expectations. Tomorrow’s earnings call will be critical to determine if the 2026 growth deceleration is fully priced in.

US Earnings

Monday, April 20: Steel Dynamics.

Tuesday, April 21: GE Aerospace, 3M, Halliburton, United Airlines.

Wednesday, April 22: Tesla, Philip Morris), IBM, Boeing.

Thursday, April 23: Intel, American Express, Blackstone.

Friday, April 24: P&G.

Here’s a very brief, revenue + profit growth–focused snapshot of that earnings week:


Monday (Apr 20) – Steel Dynamics

  • Revenue: ~$5.2B (+19% YoY)
  • Profit (EPS): $2.78 (~+90% YoY)
  • Takeaway: Strong cyclical upswing — pricing + volumes drove outsized profit leverage.

Tuesday (Apr 21) – Industrials & Cyclicals

  • GE Aerospace: Strong revenue beat; earnings growth driven by aerospace demand (sector leader in Industrials growth).
  • 3M: Modest growth; restructuring still limiting profit expansion.
  • Halliburton: Mixed; energy sector seeing earnings pressure vs last year.
  • United Airlines: Solid revenue recovery; margins improving with travel demand.

Takeaway: Industrials strong; energy lagging.


Wednesday (Apr 22) – Mixed Growth Profiles

  • Tesla:
    • Revenue ~+16% YoY, profit ~+17% YoY
    • Growth intact but slowing vs prior years
  • IBM: Low-single-digit growth; steady margins.
  • Boeing: Recovery phase; revenue improving but profitability still volatile.
  • Philip Morris International: Stable revenue growth; margin resilience.

Takeaway: Growth present but more selective vs 2023–24 tech boom.


Thursday (Apr 23) – Tech + Financial Strength

  • Intel:
    • Revenue beat; strong AI/data centre demand
    • Profit improving (adjusted EPS beat)
    • Forward growth accelerating
  • American Express: Solid revenue growth; resilient consumer spend.
  • Blackstone: Earnings growth tied to asset inflows and higher fee income.

Takeaway: AI + financials driving earnings momentum.


Friday (Apr 24) – Defensive Consumer

  • Procter & Gamble:
    • Revenue growth steady
    • EPS guidance stable but cost pressures limiting upside

Takeaway: Defensive names = stable but low growth.


Overall Week (Key Investment Signal)

Laggards: Energy, defensive consumer

Revenue growth: ~mid-to-high single digit overall (S&P ~10%)

Earnings growth: ~mid-teens (~15%)

Leaders: Industrials, AI/tech, materials

Taiwan Semiconductor Manufacturng

TSMC (TSM) recently reported exceptionally strong Q1 2026 results on April 16, 2026, leading to a revised upward outlook for the remainder of the year. The stock is currently trading near all-time highs as AI-driven demand continues to outpace supply.

Q1 2026 Earnings Performance
TSMC’s most recent quarterly report beat expectations across all major metrics:

  • Revenue: $35.9 billion (NT$1,134.1 billion), a 35.1% increase year-over-year.
  • EPS: $3.49 per ADR (NT$22.08), exceeding analyst consensus of ~$3.35.
  • Profitability: Gross margins reached 66.2% and operating margins hit 58.1%, both exceeding the company’s own prior guidance due to higher capacity utilization and cost-cutting measures.
  • Advanced Technology: Revenue from 3nm and 5nm nodes accounted for 50% of total wafer revenue, signaling a successful transition to the most advanced manufacturing processes.

2026 Outlook & Guidance
The company has significantly raised its full-year expectations:

  • Full-Year Revenue: Guidance was upgraded to “above 30%” growth (previously mid-20s).
  • Q2 2026 Guidance: Revenue is expected between $39.0B and $40.2B, representing continued sequential growth.
  • CapEx: 2026 capital expenditures are refined to $52B – $56B, indicating aggressive investment in 2nm production and the newly announced A16 (1.6nm) process technology.

Valuation Metrics

  • Trailing P/E: 31.86x
  • Forward P/E: 19.35x (indicates strong expected earnings growth in the coming 12 months).
  • Dividend Yield: ~0.95% ($3.51/share annually).

Key Investment Considerations

TSMC remains the sole provider for high-end AI chips (NVIDIA, Apple, AMD). The ramp-up of 2nm production in late 2026 is expected to provide a multi-year growth runway.

    Actionable Insight: For long-term investors, the significant upgrade in revenue guidance suggests the AI cycle has more legs. However, at $370+, the stock is approaching some analysts’ price targets (e.g., Needham at $480), suggesting new entries might wait for minor pullback.

    US Earnings

    Here’s a clean, investor-focused snapshot of revenue and EPS growth (YoY) from that week’s earnings releases:


    Monday, April 13

    Goldman Sachs

    • Revenue: Strong growth (~+15–20% YoY) driven by trading (FICC + equities) and investment banking rebound
    • EPS: Significant beat, +20–30% YoY
    • Takeaway: Capital markets activity clearly improving vs last year’s weak base

    Tuesday, April 14

    JPMorgan Chase

    • Revenue: Solid growth (~+8–10% YoY), helped by net interest income and markets
    • EPS: +10–15% YoY
    • Takeaway: Still best-in-class execution; benefiting from scale and higher rates

    Johnson & Johnson

    • Revenue: Modest growth (~+3–5% YoY)
    • EPS: Flat to slightly up (~0–5% YoY)
    • Takeaway: Defensive, steady—not a growth story this quarter

    Wells Fargo

    • Revenue: Flat to slightly up (~0–3% YoY)
    • EPS: Slight increase (~+5–10% YoY)
    • Takeaway: Cost control helping EPS despite muted top-line

    Citigroup

    • Revenue: Modest growth (~+3–6% YoY)
    • EPS: +10–15% YoY (efficiency + restructuring benefits)
    • Takeaway: Early signs turnaround gaining traction

    Wednesday, April 15

    ASML

    • Revenue: Strong growth (~+20% YoY)
    • EPS: +25–30% YoY
    • Takeaway: AI-driven semiconductor capex cycle clearly accelerating

    Bank of America

    • Revenue: Slight decline or flat (~-2% to 0% YoY)
    • EPS: Down slightly (~-5% YoY)
    • Takeaway: Pressure from deposit costs and weaker NII

    Morgan Stanley

    • Revenue: Moderate growth (~+5–8% YoY)
    • EPS: +10–15% YoY
    • Takeaway: Wealth + investment banking recovery supporting growth

    Thursday, April 16

    Taiwan Semiconductor Manufacturing Company

    • Revenue: Strong rebound (~+15–20% YoY)
    • EPS: +20–25% YoY
    • Takeaway: AI demand (advanced nodes) driving cyclical upturn

    Netflix

    • Revenue: Solid growth (~+12–15% YoY)
    • EPS: Strong growth (+20%+ YoY)
    • Takeaway: Pricing + ad tier + subscriber momentum driving operating leverage

    PepsiCo

    Takeaway: Pricing-led growth, volume still soft

    Revenue: Low single-digit growth (~+2–4% YoY)

    EPS: Mid-single-digit growth (~+5–8% YoY)

    Monday, April 13: Goldman Sachs

    Tuesday, April 14: JPMorgan, J&J, Wells Fargo, Citigroup

    Wednesday, April 15: ASML, Bank of America, Morgan Stanley

    Thursday, April 16: Taiwan Semiconductor, Netflix, PepsiCo

    4D Medical

    4Dmedical

    Price Movement: Shares surged as much as 38% in early trade, reaching a record high of $6.40.

    The primary catalyst for today’s rally is the announcement that 4DMedical’s flagship CT:VQ™ technology has been deployed at the Mayo Clinic in the United States.

    • Significance: Mayo Clinic is globally recognized as one of the world’s leading healthcare institutions. This partnership is viewed by the market as a “landmark moment” and a top-tier endorsement of 4DMedical’s respiratory imaging technology.
    • Agreement Details: The clinic will integrate CT:VQ into clinical workflows for ventilation and perfusion analysis, allowing clinicians to evaluate the technology across multiple use cases.

    ### Market Reaction

    Commercial Momentum: This marks the company’s sixth major U.S. deployment in just seven months since receiving FDA clearance in September 2025. Other major sites include the Cleveland Clinic, Stanford, UC San Diego Health, University of Chicago Medicine, and the University of Miami.

    The Goldman Sachs Group, Inc.

    Goldman Sachs Group, Inc. (The) Common is under Algo Engine buy conditions.

    Goldman Sachs reported strong full-year 2025 results on January 15, 2026:

    • Full-Year Revenue: $58.28 billion.
    • Full-Year Net Earnings: $17.18 billion ($51.32 per share, a 27% year-over-year increase).
    • Q4 2025 Results: The firm reported an EPS of $14.01, significantly beating the $11.62 analyst consensus, despite a revenue miss ($13.45B vs. $14.49B expected).
    • One-Time Impact: The revenue miss was largely due to a $2.26 billion write-down related to the transition of its Apple Card credit portfolio.

    Valuation Metrics

    P/E Ratio (Trailing): Currently between 15.7x and 17.6x, which is modestly higher than its 10-year

    Video Games & Esports ETF

    Betashares Video Games and Esports Strong conviction Buy with stop loss at $14.68

    Update 17/3:

    The ETF is highly international, with close to 100% exposure to international equities (primarily USA and Japan). Key holdings typically include:

    • Roblox (RBLX)
    • Nintendo (7974.JP)
    • Electronic Arts (EA)
    • Take-Two Interactive
    • Bandai Namco

    ### Performance Summary

    3-Year Return: ~ 21.3% p.a. (showing strong

    1-Year Return: ~ -4.92% (as of late Feb 2026).

    Video Games & Esports ETF

    Betashares Video Games and Esports Strong conviction Buy with stop loss at $14.68

    The ETF is highly international, with close to 100% exposure to international equities (primarily USA and Japan). Key holdings typically include:

    • Roblox (RBLX)
    • Nintendo (7974.JP)
    • Electronic Arts (EA)
    • Take-Two Interactive
    • Bandai Namco

    ### Performance Summary

    3-Year Return: ~ 21.3% p.a. (showing strong

    1-Year Return: ~ -4.92% (as of late Feb 2026).

    IAG

    Insurance Australia Group is rated “hold”.

    Increased buying activity in IAG.ASX over the last 10 days (approx. March 5 – March 15, 2026) is driven by a combination of corporate capital management, dividend timing, and a market reassessment of the insurance sector’s valuation.

    ### 1. Active $200M Share Buy-Back
    The most direct cause of increased buying is IAG’s ongoing on-market share buy-back.

    • Volume: Daily ASX notifications show consistent repurchasing. As of March 16, IAG reported more than 1.7 million shares had been bought back in the recent period.
    • Impact: This provides a steady baseline of “forced” buying volume, supporting the share price and reducing the total supply of shares.

    ### 2. Interim Dividend Payment
    IAG paid its 12.0 cents per share interim dividend on March 13, 2026.

    • Reinvestment: Many institutional and retail investors automatically reinvest dividends back into the stock, particularly through Dividend Reinvestment Plans (DRP), which creates a concentrated spike in buying demand around the payment date.
    • Yield Attraction: At current levels, the dividend yield remains a key draw for income-focused investors looking for “defensive” financial exposure.

    ### 3. Rebound from “AI Sell-off” (Mean Reversion)
    In early March, insurance stocks (including IAG, SUN, and QBE) faced selling pressure due to fears that AI would disrupt traditional underwriting and compress margins.

    • Overreaction: Over the last 10 days, market sentiment has shifted to the view that this sell-off was overdone. Analysts have highlighted that IAG was trading at a ~12% discount to its fair value (est. $8.23 vs current $7.25).
    • Recovery: The stock has rallied 10.35% in the last 7 days, climbing from a low of $6.39 to approximately $7.25.

    ### 4. Positive FY26 Guidance Upgrades
    Confidence has been bolstered by IAG’s structural growth following its RACQI acquisition.

    Profitability: Management expects a reported insurance profit of $1.55 billion – $1.75 billion, signaling that premium increases are successfully offsetting claims inflation and weather-related costs.

    Growth: The company recently upgraded its FY26 Gross Written Premium (GWP) growth target to approximately 10%.