US Credit Card Defaults On The Rise
US media reports suggest the US economy is flashing a warning sign that could mean US is headed for a downturn.
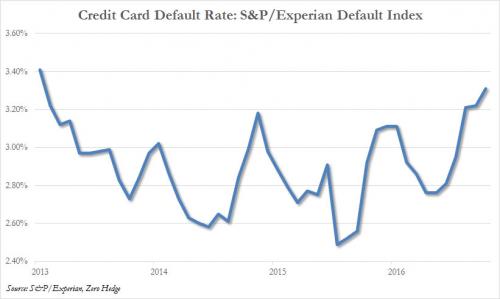
Credit card companies are starting to grow nervous as the net charge-off rate, or the percentage of loans that credit card issuers write off as a loss, has just hit its highest level in four years, a continuation of several quarters of the rate rising.
The trend hit all major card issuers and is starting to eat into bank earnings. The current rate is 3.29%, but it is still a long way from the peak hit in 2010 of 10%.
The rate had dropped for 24 straight quarters during the recovery, until a reversal in recent quarters.
The “cause and effect” logic is that once credit card defaults begin to rise, the default rate on mortgages also begins to rise, which is a much bigger problem for the US economy.
 Credit Card Default Rate
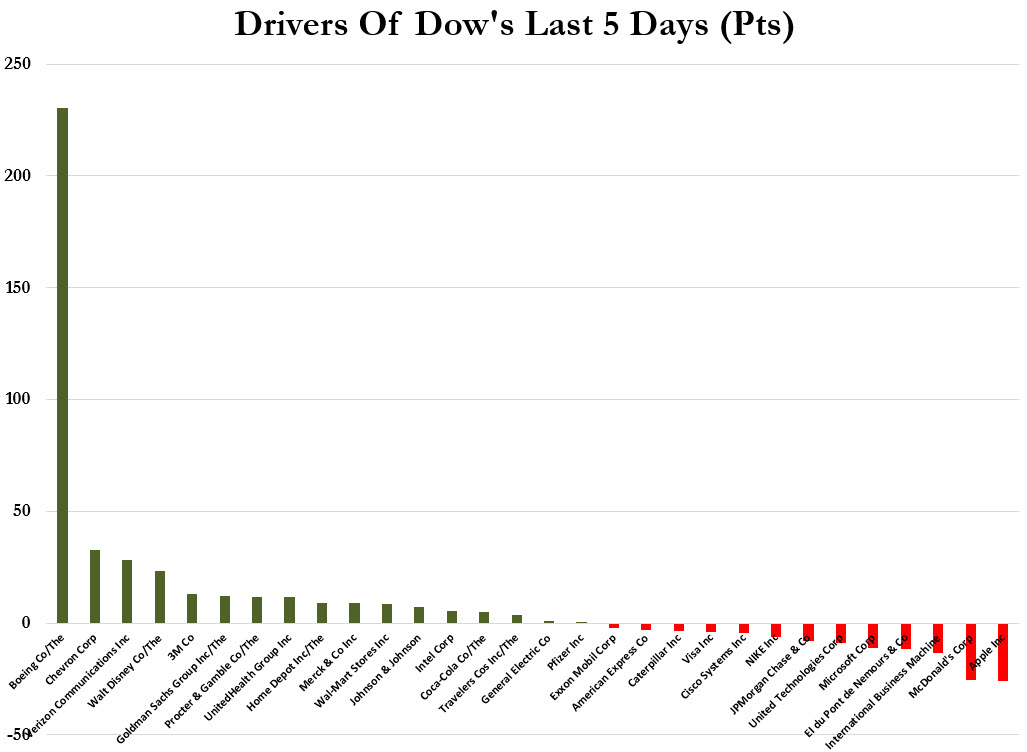
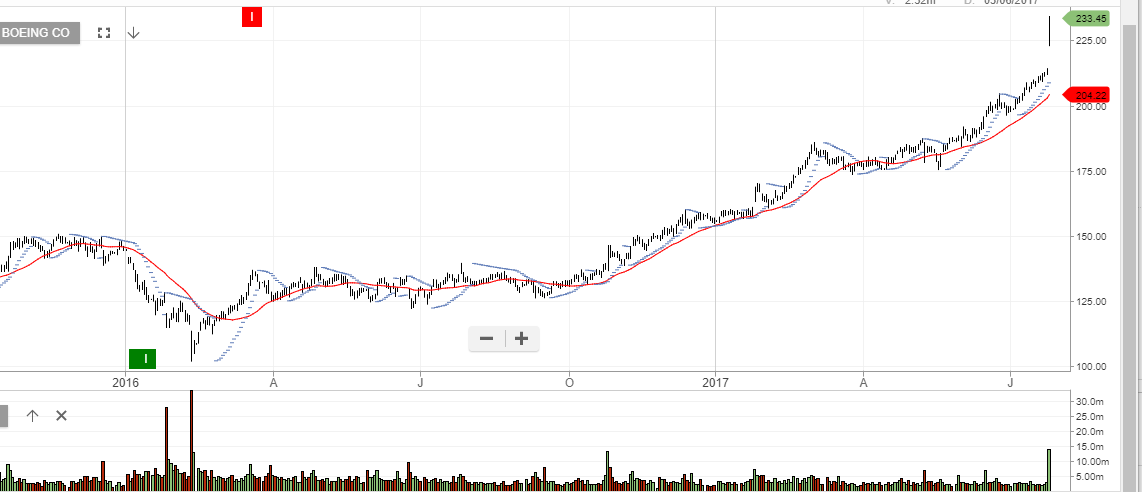
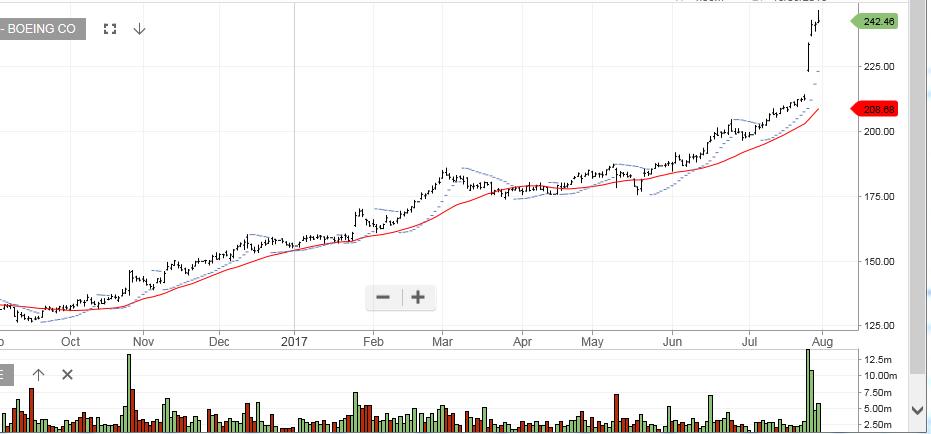 Boeing
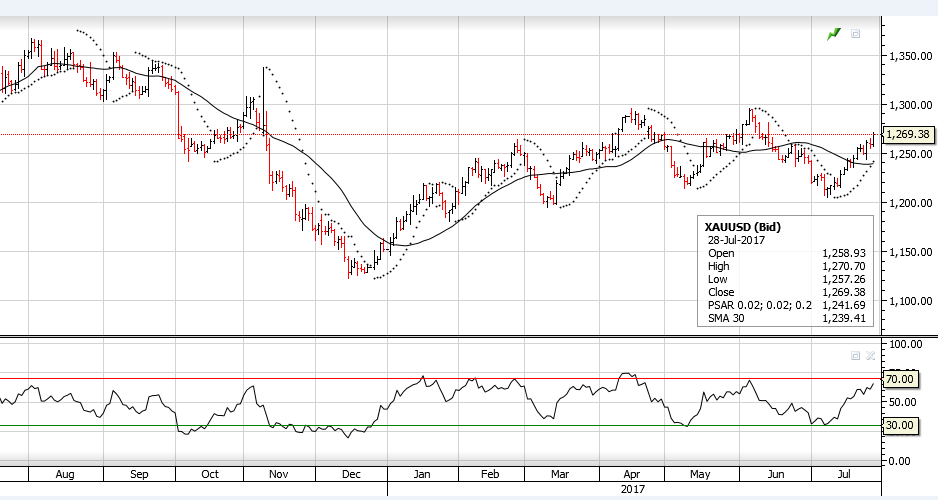 Gold
Gold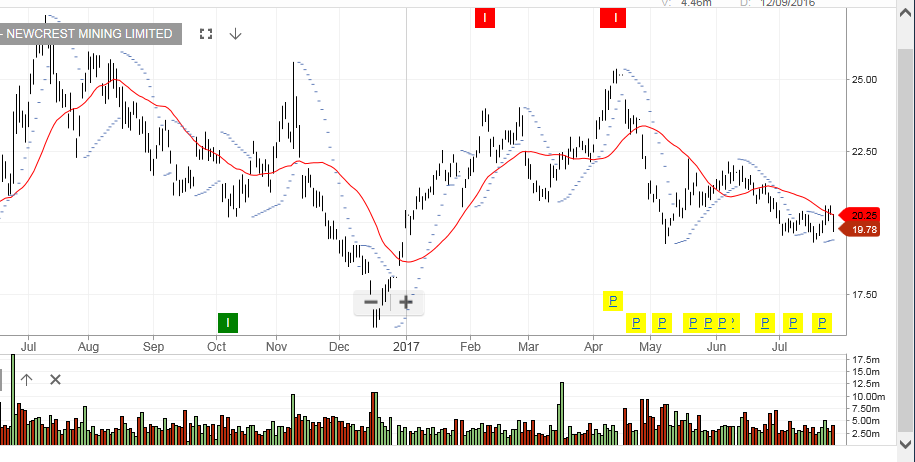 Newcrest.
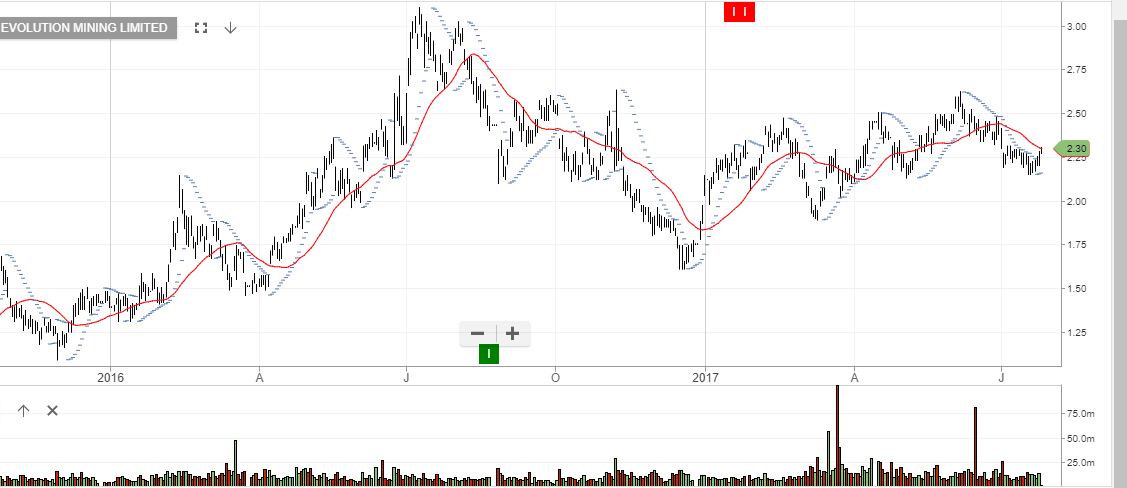
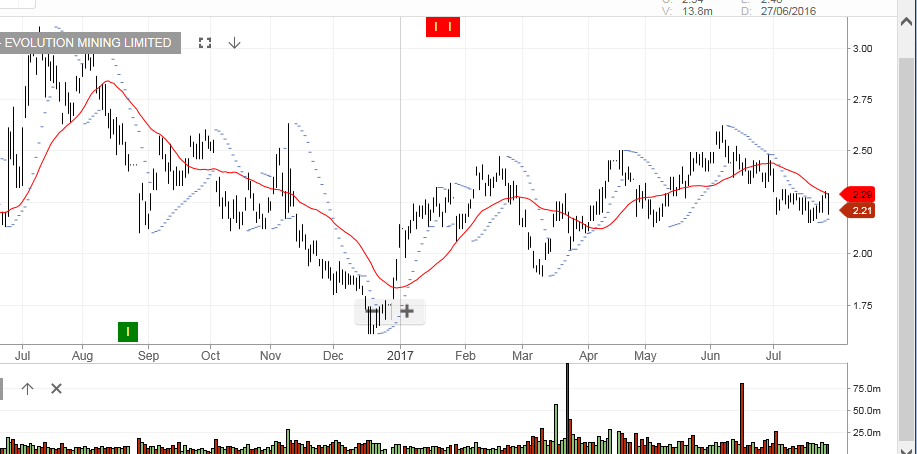 Evolution Mining
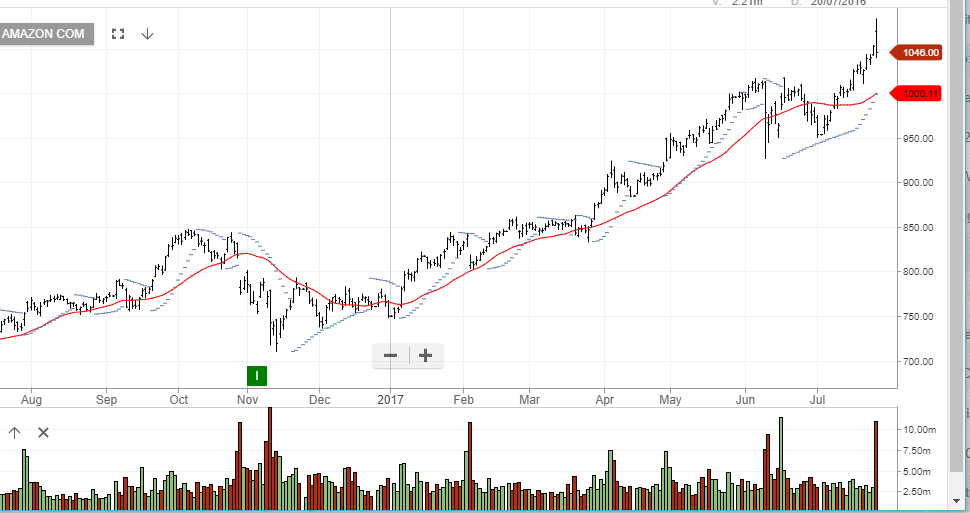
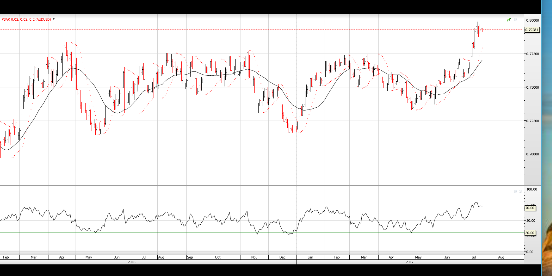
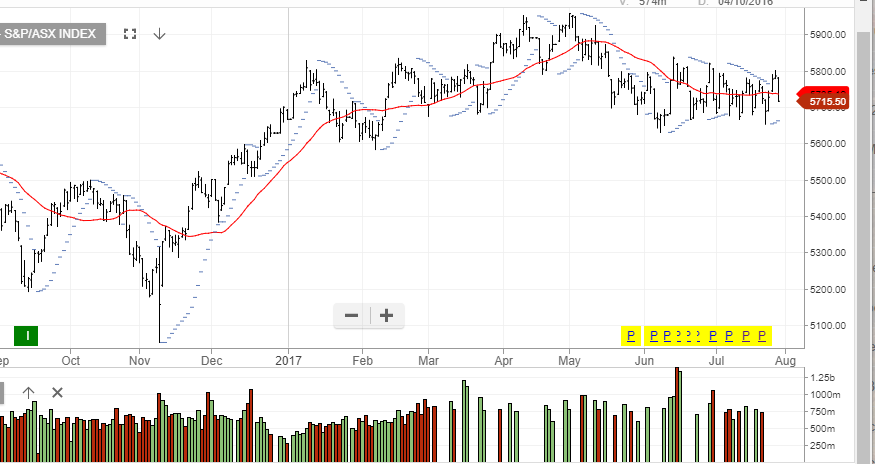 XJO
XJO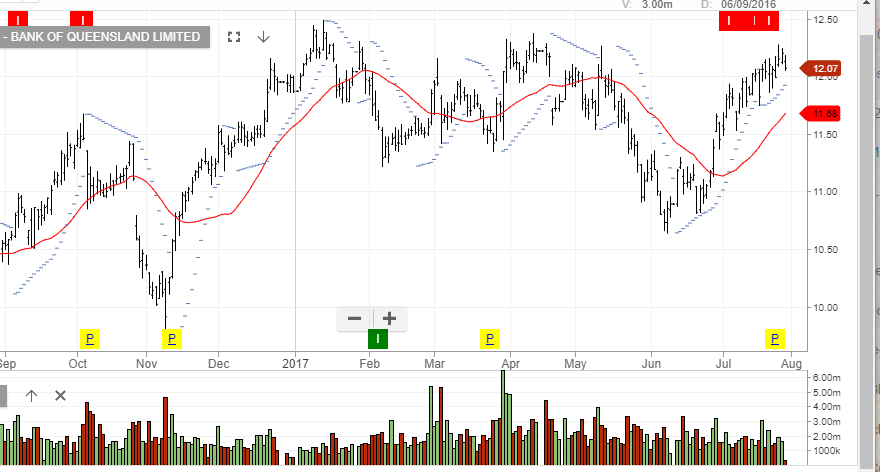 BOQ
BOQ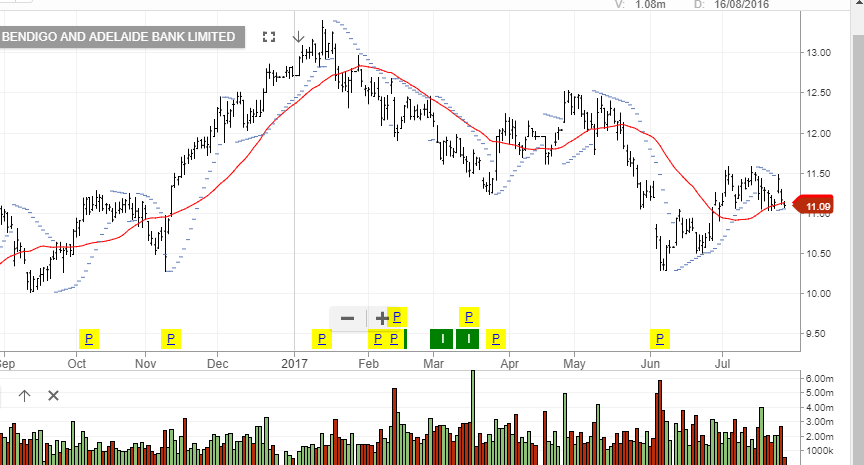 Bendigo