ETF Update: Buy The YANK

The USD Index had its strongest week in over two months as better-than-expected GDP numbers, combined with hawkish comments from FED officials, lifted the Greenback against all the major currency pairs.

The bulk of the gains were against the EURO and YEN, with the AUD/USD finishing the week pretty much unchanged.

We don’t expect this to last. With the RBA overnight interest rate policy firmly on hold, the divergence of interest rate policy trajectory between the USA and Australia will push the AUD/USD lower.

Technically, the AUD/USD closed the week below the 30-day moving average with the RSI momentum indicators pointing lower. We see the first key support level at .7580 and have a medium-term target near the January low of .7160.

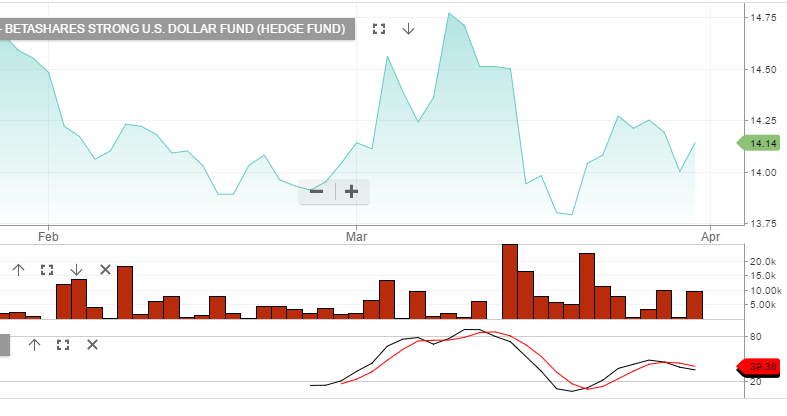
Investors who want to profit from the a lower AUD/USD can look to buy the BetaShare YANK ETF. YANK is an inverse ETF with a 2.5% weighting. This means that the share price of YANK will increase by 2.5% for every 1% fall in the AUD/USD.

With the YANK currently priced around $14.20, we estimate the share price to rise to $16.40 when the AUD/USD reaches .7160.

Call in for more information about YANK and the other ASX listed ETFs


Chart – YANK ETF

Buy The Dip in Gold

After a sharp rally on the back of equity weakness last week, Gold has consolidated above the $1240.00 level.

The technical picture is still constructive as the yellow metal is still above the 30-day moving average  at $1234.00 and the RSI reading at just above 56.00.

There are still many global stock indexes trading at elevated prices. The market has proven that the inverse correlation of Gold moving higher, as stocks move lower, still intact.

We see scope for a test of the $1235.00 level before trading higher next week. Our medium-term target is the November 10th high of $1292.00.

Investors looking to profit on a move higher can look at either the Vectors Gold Miners ETF (GDX), buying the dip in Newcrest Mining down to $22.00, or placing Newcrest Call Option strategies.

Chart – GDX
Chart – NCM

Algo Sell Signal For Transurban

The Algo Engine triggered a sell signal in Transurban (TCL) yesterday at $11.72.

The stock has rallied over $1.00 since last week’s announcement that tolls to pay for an upgrade of the Inner City By-Pass in Brisbane.

From a broader perspective, TCL has traded between the $12.65 high made in August, and the low of of $9.45 posted in early November.

The $11.72 level is a bit higher than the 50% retracment of of this range, but we see stiff chart resistance at $12.00. We see the first level of support in the $10.80 area.

We own TCL in client portfolios from lower levels and we’ve been bullish in recent weeks on TCL and utilities, in general. This view has been predicated on the faltering backdrop for the the global relation trade.

The rally in TCL will soon stall at near $12.00 and investors should sell call options into September, with a view towards maintaining exposure to the upcoming $0.25 dividend in June.

Chart-Transurban

US 10-year Yields

The Dow Jones 30 posted it’s 7th straight lower close for the first time since 1978.

As a result, the US 10-year bond yields fell to a 1-month low of 2.38%. An increase in equity market volatility could could lead to another 10 to 15 basis points of downside on the yield.

Some of the local names that have moved higher on the lower yields have been SYD, TCL, WFD  and, to a lesser degree, TLS.

It’s likely interest rate stabilization will work as a near-term cap on these companies and allow for a covered call strategy to enhance the portfolio returns

Bendigo Bank: Reverting Higher

On March 16th, the ALGO engine flagged a buy sign for Bendigo Bank (BEN) at, or near, the $11.00 level.

BEN shares have reached $11.68 in early trade today.

Looking from a broader perspective, we believe the chart reflects a mean-reversion pattern, as opposed to the beginning a protracted trend higher.

On January 12th, BEN posted a high of $13.40 before reversing lower. On March 24th, BEN traded as low as $11.20 and then began to move higher.

Taking into account the high valuation of the domestic banking sector, we would expect the upside in the current move to be capped at or near  $12.30, which is the 50% reversion level of the move from $13.40 to $11.20.

Prudent money management on this trade would be to work a sell stop at last week’s low of $11.20.

Chart-Bendigo

CBA- Back to the $80.00 Handle?

Shares of Commonwealth Bank (CBA) have been trading below the 30-day moving average of $83.80 for the last four consecutive trading sessions.

As the technical picture continues to deteriorate, we have looked at some previous chart resistance levels which could now act as price support.

Between late January and early February, CBA tested the $81.10 level three times over the course of 10 trading sessions; this will be the first key support level.

However, going back to May of last year, CBA shares failed to break above $80.00 five times before extending higher in July. We feel that this is a more significant support level and a reasonable medium-term target.

Investors and subscribers will remember that we sold European-style call options on CBA in late January. By selling the $83.01 strike-price into March, we were able to collect $2.50 in option premium and still hold the shares to collect the $2.00 dividend paid in February.

Those options will expire this Thursday.

As such, we will look to reset the derivative overlay strategy in CBA on corrective price moves higher.

Chart-CBA

US Update: Trump Puts Healthcare Reform On Hold

US Stock Indexes finished the week mixed as many investors were focused on how the House of Representatives would vote on the administration’s bill to repeal major parts of the current health care program, referred to as Obamacare.

As the day progressed, the DOW and SP 500 swung between positive and negative territory as news reports gave conflicting stories about whether the bill would pass, or even be voted upon.

In the end, after Mr Trump’s ultimatum failed to yield more “yes” votes , the embattled bill seeking to start the healthcare reform process, and free up almost a trillion dollars in tax dollars, was pulled from the floor.

As a result, Mr Trump suffered a second consecutive blow from within his own Republican party. This party dissension will likely cast doubts on the President’s ability to deliver on other policy measures including; tax reform, infrastructure spending and the debt ceiling legislation.

The announcement that the vote was cancelled happened too late in the day to have any material impact on today’s trade.

However, going into next week, investors will have to address the question of how Mr Trump can now unify his own party behind his administration; and whether this legislative defeat will “deflate” the “reflation” trade, which was triggered after he was elected?

Strong Rally In Caltex

Despite a generally weak Crude Oil market, shares of Caltex have rallied almost $2.00 this week.

The shares were lifted off a 3-year low after the company announced a stronger-than-expected refiner margin of USD 12.71 per barrel for the month of February.

This is an increase from last year’s refiner margin of USD 12.43 per barrel and well ahead of the street’s estimates of USD 9.74 per barrel.

The increase in the margins has had a knock-on effect and lifted the calendar year EPS forecasts by 1.3% to the $2.40 range.

We now see chart resistance for Caltex at, or near, the February highs of $31.00.

BOQ: Caution In Front of Results

After trading as high as $12.50 on January 12th, shares of BOQ have followed the same “sideways-to-lower” pattern as the rest of the Australian banking names.

With first-half 2017 results due on March 30th, this pattern could continue and even breach the February low price of $11.30.

The headwinds of negative loan growth and falling margins don’t appear to be fully priced-in at current levels.

The trading multiples of BOQ are not cheap, and with 2017 EPS growth estimated at under 3%, we believe an $11.00 price is more likely than a $12.00 price over the medium-term.

ALGO Buy Signal: ASX

The ALGO engine generated a buy signal for shares of ASX at $49.00.

Many investors were able to write covered calls or exit long positions of ASX around the $52.50 level, last traded in early February.

We are cautious of the general market sentiment , but still like the longer-term growth prospects and a move back at least to the 30-day moving average near $51.10.

A tight stop-loss metric should be employed on long positions of ASX at, or near, the January 2nd low of $49.15.