Banks – Chart Update
The following charts show the correlation of the US bank price performance versus leading ASX banks.
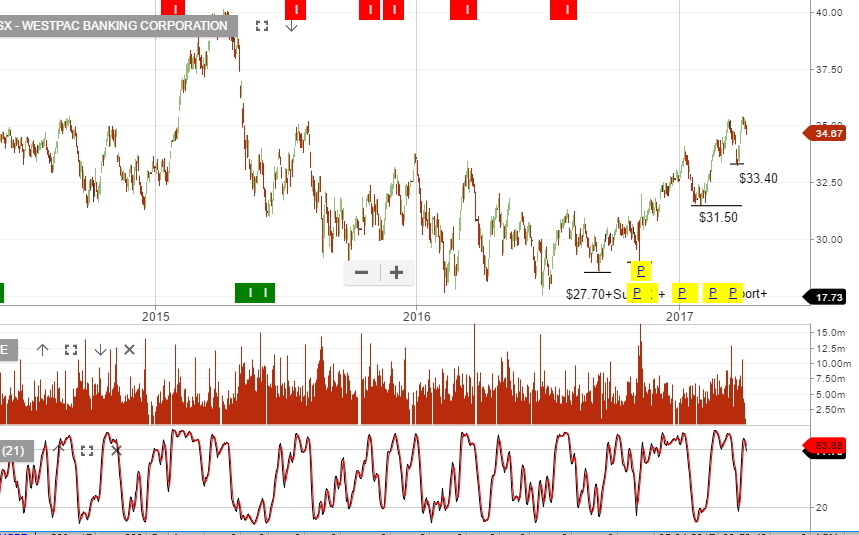
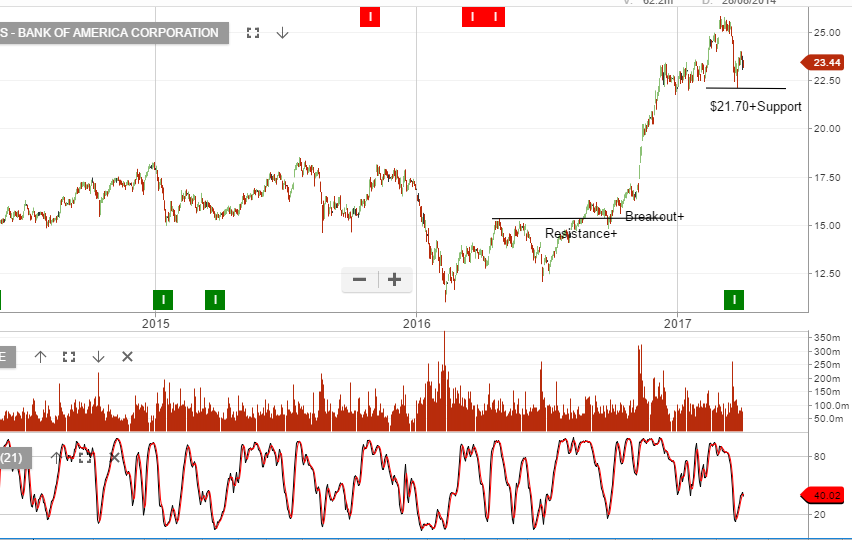
The following charts show the correlation of the US bank price performance versus leading ASX banks.
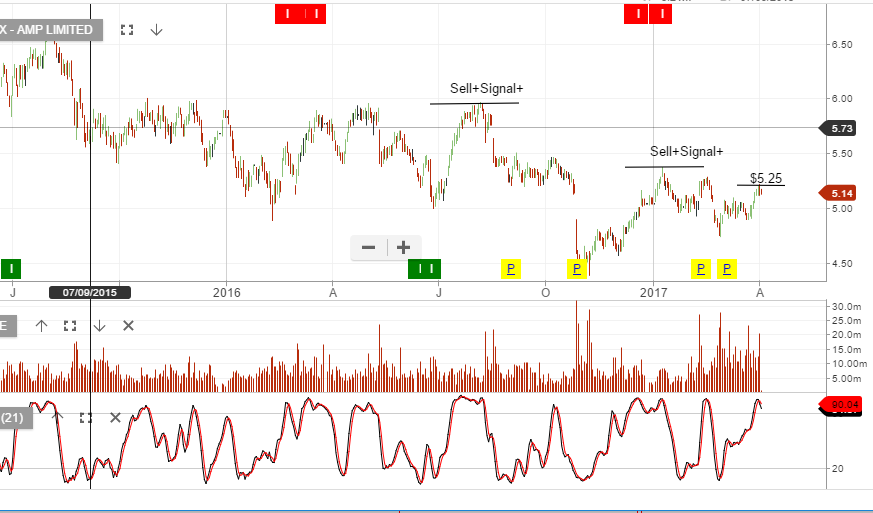
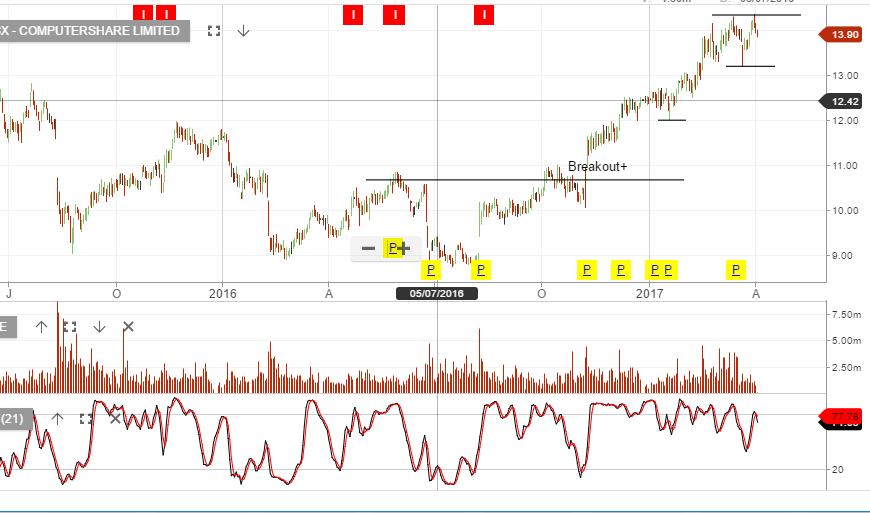
A number of stocks within the ASX top 50 appear to be setting up medium term short signals.
We’re mindful of the upward bias in equity indexes, however, much of this is driven by broad inflows into index funds and valuations are becoming stretched, even if Q1 earnings in the US hit their target.
Here is a list of the names that are worth taking a closer look at….
AMP, LLC, SGP, CPU, JHX, & AGL.
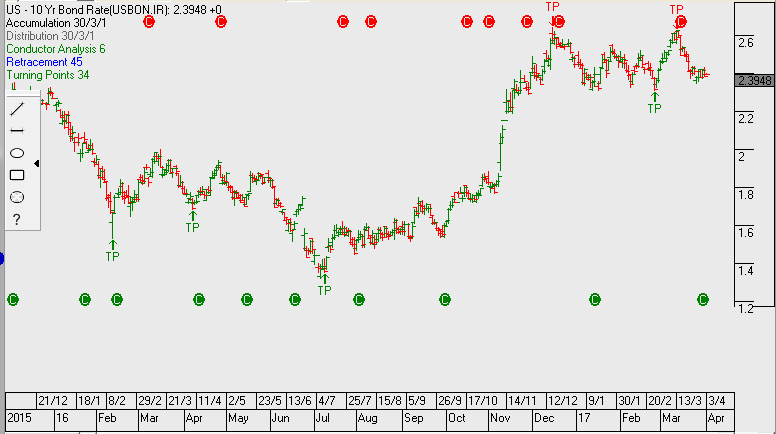
The chart below shows the yield on the US 10YR bonds retracing from a high of 2.62% to now trading at 2.39%. We find this interesting given the positive commentary around US growth and market expectations for further rate rises in 2017.
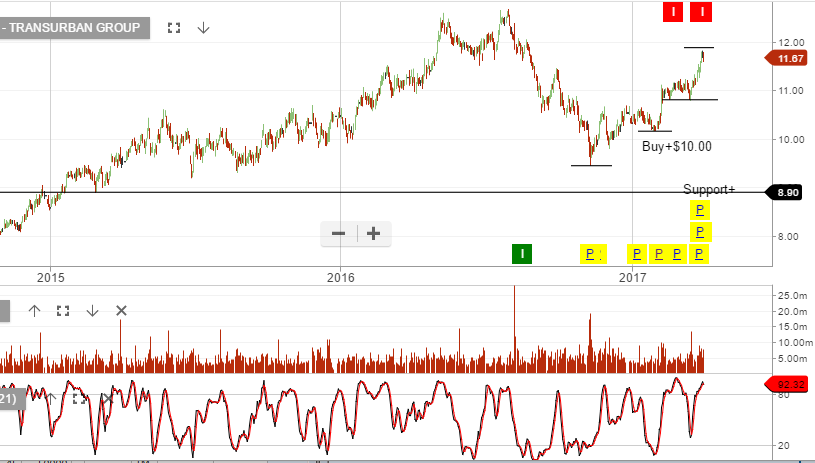
The by-product of the lower US yield story has manifested in domestic yield sensitive names such as Transurban being among the best performing stocks within the ASX50.
The higher low formation at 5680 remains in place.

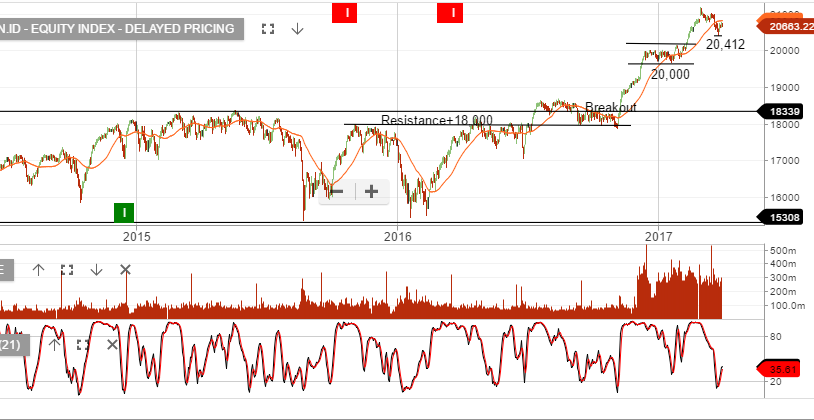
The higher low formation at 20,412 remains in place.
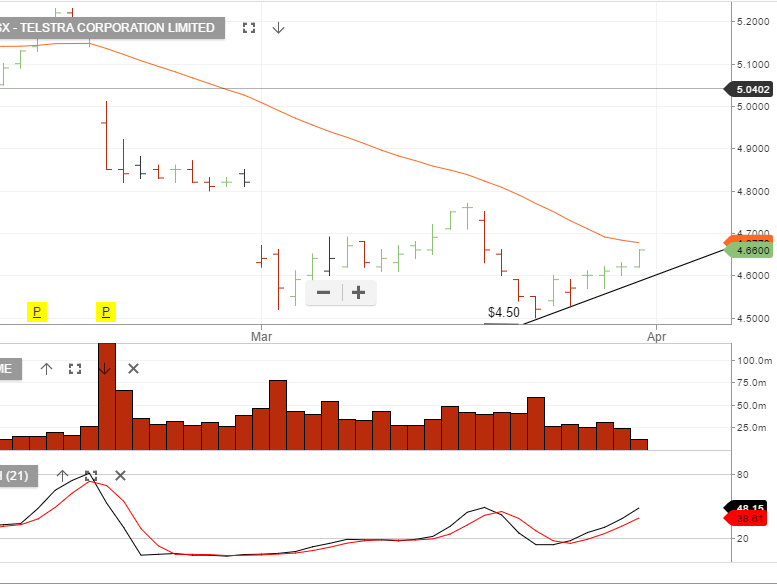
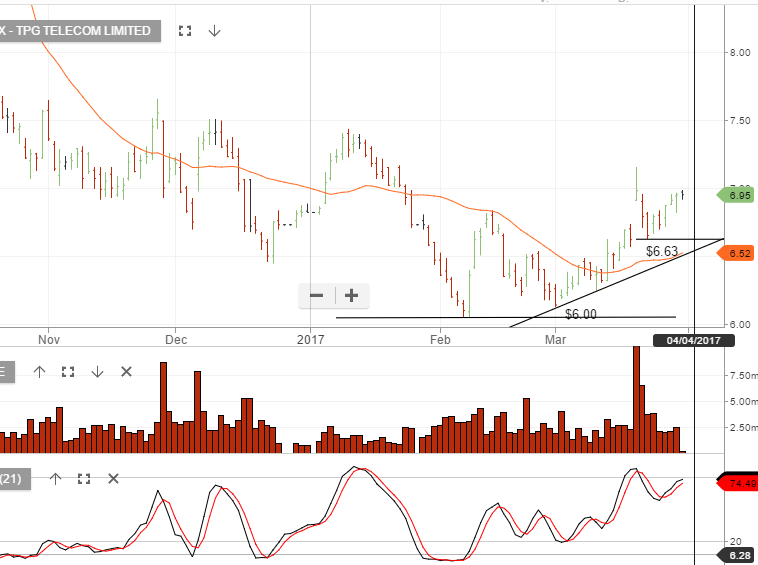
Over recent weeks we’ve watched money flow into defensive yield names such as Sydney Airports, Transurban & GPT to name a few. Telstra has somewhat been left behind and we therefore may see buying support build from the current oversold levels.
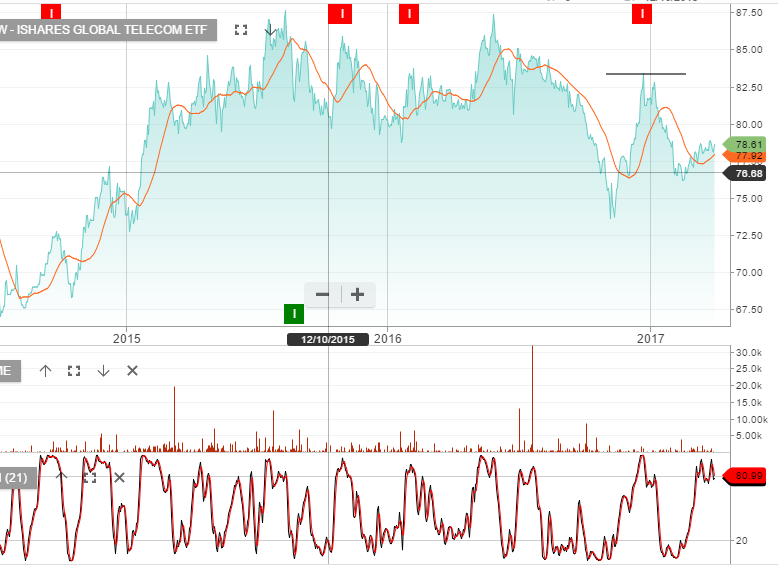
We’ve focused on the short-term chart patterns in both TLS and TPM as a point of interest. Also, we’ve included a chart of the iShares Global Telco ETF to help capture the “bigger picture” trend within the large cap global Telco companies overall share price performance.
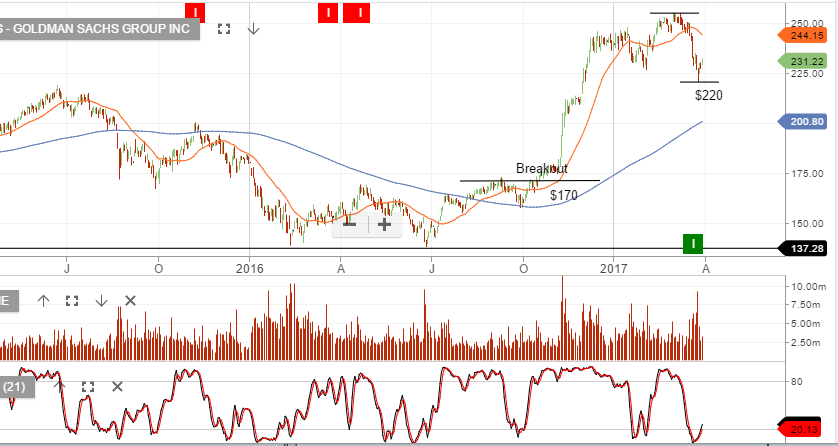
Our Algo Engine flagged recent buy signals across most of the major US financial stocks and we’re now into the third day of buying support, since the buy signal was triggered.
We strongly advise tight stop-losses below the recent lows. The chart patterns are all relatively similar to the example below.
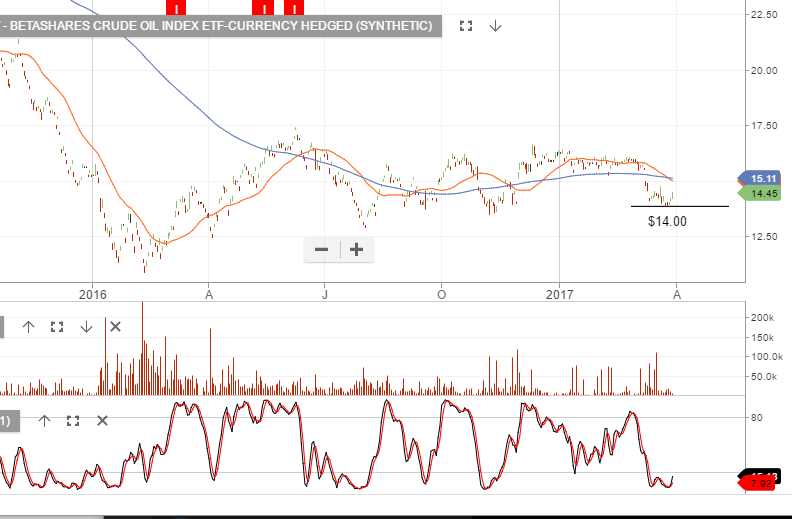
We’re watching for support building on the recent low in both the OOO BetaShares Crude Oil ETF and the broader based QRE BetaShares ASX200 Resources ETF.
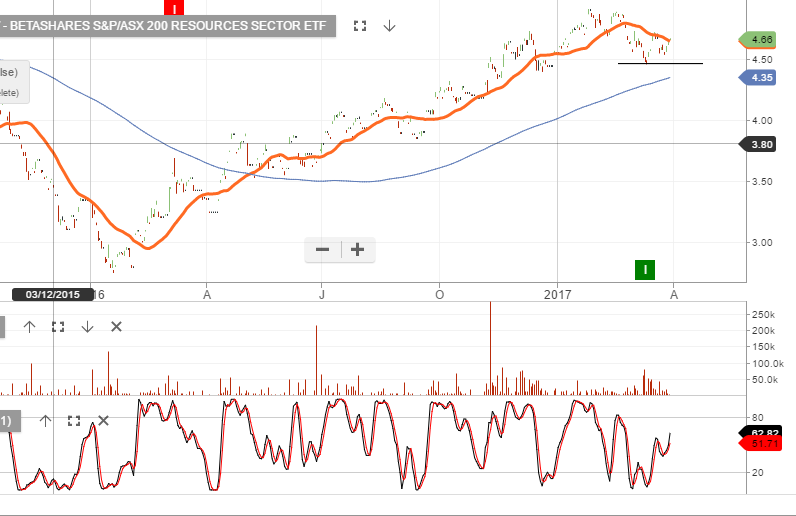
The XJO continues to push the upper range of the recent consolidation band. If the resource names can hold their current higher low formation, we may see further short-term strength in the index.
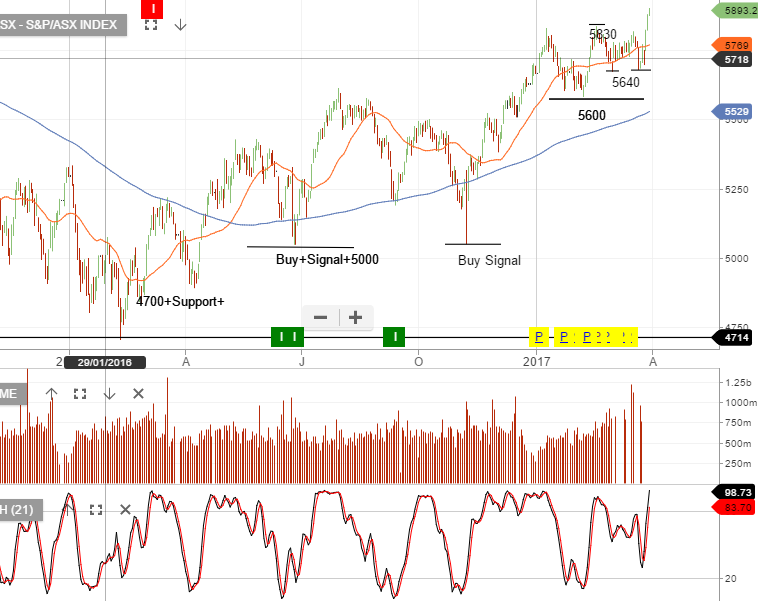
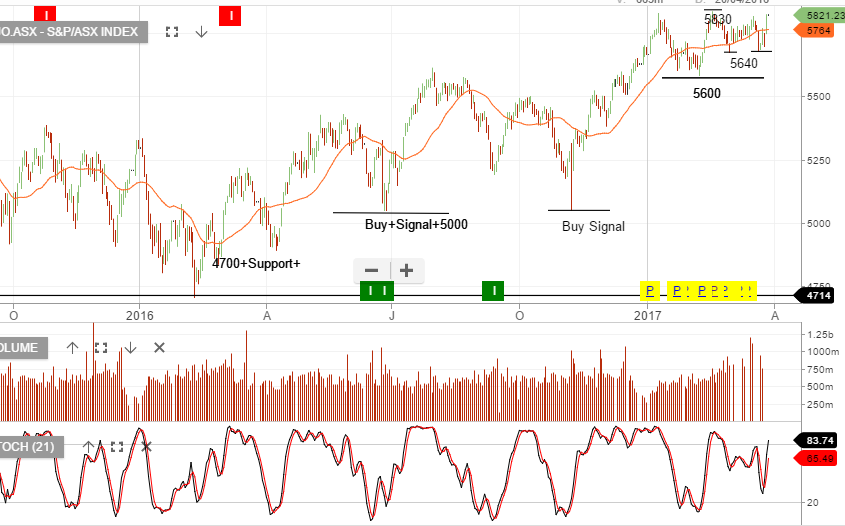
The XJO remains in a bullish “higher high & higher low” formation. Valuations are stretched and stop-losses on a reversal back through 5640 is a prudent risk management strategy.

Level 17 Chifley Tower
2 Chifley Square
Sydney, NSW 2000
1300 614 002
Investor Signals Pty Ltd
ABN 44 143 555 453