Correlation – USD & US 10-year yield

With the USD struggling to move higher as 10-year bond yields move back over 2.50%, some market commentators are calling the USD rally over. We don’t necessarily agree with that assessment but we do recognize that the USD/10-year yield correlation has changed.

The first few days of the Trump administration has been received by the FX market with a mix of relief and fatigue. The lack of follow through on his more aggressive campaign proposals in the area of international trade has been a source of relief.

At the same time, the FX market has traded in a less sensitive pattern to the lack of consistency amongst the views of top administration officials with regard to the USD policy. The net result of the mix of fatigue and relief has been a broad unwinding of bullish USD positions  and higher volatility across the major FX pairs.

Although the USD policy hasn’t been discussed directly, it seems the new administration is willing to talk the USD down. This lingering political risk in the USD has seen a rapid breakdown in the percentage correlation between the USD and 10-year yields. 

On November 1st, the directional correlation between the USD and the US 10-year yield was 93%. This means that the USD was moving higher as US yields moved higher on a 93% correlation. However, as of this Tuesday, this correlation has dropped to just under 50%.

It’s difficult to determine how long this condition might last. Considering  two of the biggest current drivers in the FX market are policy comments from the new administration (which aren’t scheduled) and the steady increase in US equity prices, which seem to be moving further into over-valued territory.

It seems reasonable to expect in the near-term that US equity prices will correct from the recent all-time highs and 10-year yields to find some resistance in the 2.60% area. In this case, the directional impact in the USD would be a bit clearer to map. In general, when the market moves into a “risk-off” phase, the USD will firm against all G-7 pairs except the JPY.

The two key data points in the US today will be the Durable Good orders and Advanced GDP. Both of these data sets have the potential to rattle the market if they print wide of expectations. Between the two, we believe the risk with the GDP number is asymmetrical to the downside. In other words, the “risk-off” trade will be greater on a weaker print than the “risk-on” impact of as better report.
ASX200 – XJO Technical Review

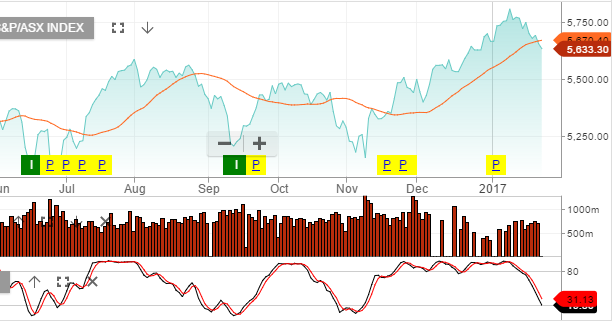
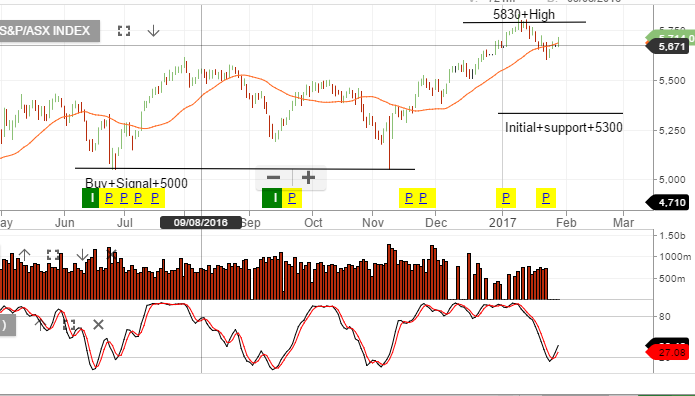
The XJO has bounced off Monday’s low of 5600 points. A combination of the US indices trading modestly higher and the short term oversold conditions in the Australian banks, lead to the minor rally in the XJO. However, with relatively weak top line revenue growth in the US, we still remain cautious on the expected price action in the week ahead.

A break above 5830 will be bullish and a rollover in price around 5750 followed by a later break of the 5600 support will be quite negative.

Chart – XJO


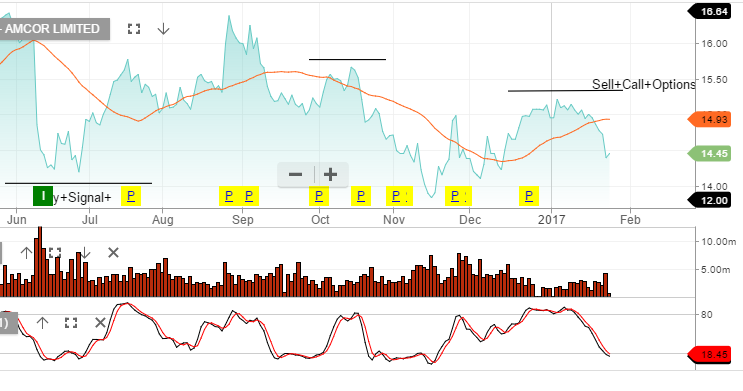
Amcor – Technical update

On February 13th, Amcor will report profits for the July – Dec 2016 period.  We’re looking for the net profit to beat market consensus of $300m.

AMC trades on 17x PE and 4.2% forward yield.

We hold Amcor in our investor model and have been aggressive with selling  the covered call strategy. Whilst we like the defensive qualities of the business, it’s at the top end of our valuation range.

Through adding the covered call option we’re generating 10% cash-flow from the dividend and option premium.

Chart – Amcor


BHP – Production Report

BHP will release its 2Q FY17 production report tomorrow. We anticipate the strength in iron ore, coal and copper will likely see production tracking in-line with FY17 guidance.

The forecast for FY17 revenue of US$40b and net profit of $6.8b should generate an EPS of $1.25, which will  place the stock on a 3.3% forward yield.

We remain long BHP with covered call options at or near $28 into April/May as our preferred strategy.

Chart – BHP


XJO – Technical Update

After an 8 year bull market we’re becoming increasingly concerned about equity valuations over the next 3 to 12 month. There are concerning signs in markets and these are starting to show up in the charts.

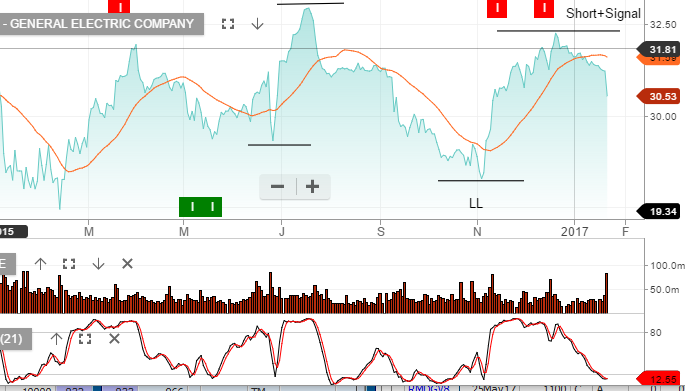
Many large-cap US stocks are showing a “rolling-over” style technical pattern. Following GE’s earnings result last week, along with recent Chinese export data, we’re getting a sense that risks are building.

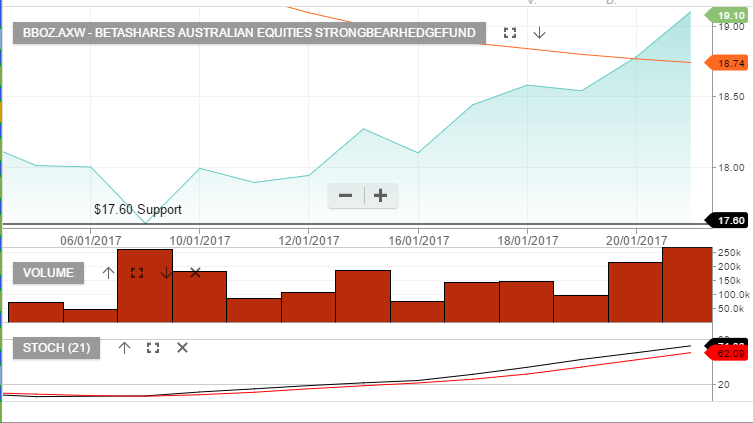
We’ve used the recent rally in banks as an opportunity to take profits and re balance portfolio’s towards defensive names. We’re also adding short exposure through index ETF’s over the XJO and S&P500.

Chart – XJO

Chart – GE


BXB – Algo Short Signal

BXB released a 1H17 trading update which included an FY17 profit warning.

BXB announced that it expects 1H17 constant currency sales and underlying profit growth of only 3%, down from previous forecast of 7 – 10%.

North America Pallets were impacted by both revenue and cost pressures.

We’ve been concerned about BXB’s high PE valuation and low compressed yield. To protect against the risks, we  hedged BXB by approximately 5%, whilst keeping exposure to the upcoming dividend.

At $10.00 we think BXB is a new counter trend buying opportunity and any short exposure or hedging should be closed and new long positions established.

We’ll keep you informed via the blog when this change in directional strategy occurs.

Chart – BXB

ASX Earnings – We’re Watching These Results

Here is a list of the first group of companies reporting where we’ll be reviewing the earnings results and keeping you informed….

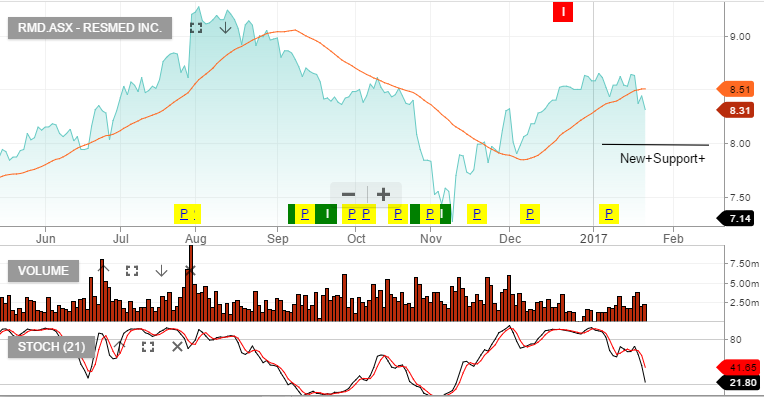
Resmed 24th Jan – Expecting better numbers following distributor de-stocking in the September quarter. New mask release should boost sales.

Tabcorp 2 Feb – Too early for any benefit from the Tatts acquisition, however, we’re looking for commentary on forecasts and cost savings.

James Hardie 2 Feb – US building cycle remains strong but we’re now cautious on James Hardie based on valuation concerns. Need to see EPS growth of 15%+

Transurban 7 Feb – We’re expecting strong free cash flow and minor dividend upgrades.

CIMIC 8 Feb – Expecting solid growth numbers and commentary on the integration outlook of UGL following the recent take-over

RIO 8 Feb – Good production numbers and we expect earnings to meet consensus forecast.

AGL 9 Feb – We’re concerned the market is too optimistic here and we will be looking at this result closely.

AMP 9 Feb – After the downgrades from the under-performing life insurance, we question what the future earnings look like. AMP as an asset manager is a very attractive business, we just need to re-establish the expected EPS growth rate.

Amcor 13 Feb – Looking for confirmation of 8% EPS growth

Ansell 13 Feb – FX impact could be  a minor negative but the underlying business is improving. We’re looking for detail and timing on the pending corporate restructure strategy.

Chart – RMD


Woodside Petroleum – Valuation Review

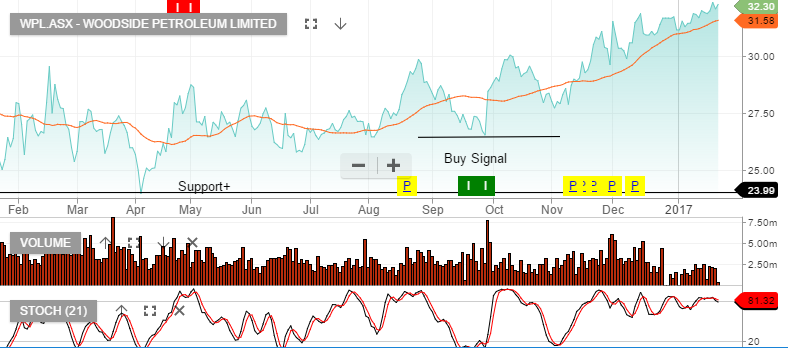
Woodside reported DecQ16 Production above market estimates on stronger LNG production. The result was driven by a stronger-than-expected performance from North-West Shelf & Pluto LNG.

The production beat helped DecQ16 revenue which increased to US$1 billion

CY17 production guidance will see volumes down 5- 10%. This is mainly due to the reduction in Woodside’s share of the NWS Joint venture.

2017 forecast revenue US$3.9b (flat on previous year), EBIT of US$1.5b, net profit of US$1b, EPS of US$1.30 places the stock on a forward yield of 4%.

Chart – Woodside