Watch Monday’s Opportunities in Review Webinar
The recording from Monday’s webinar is available below:
The recording from Monday’s webinar is available below:
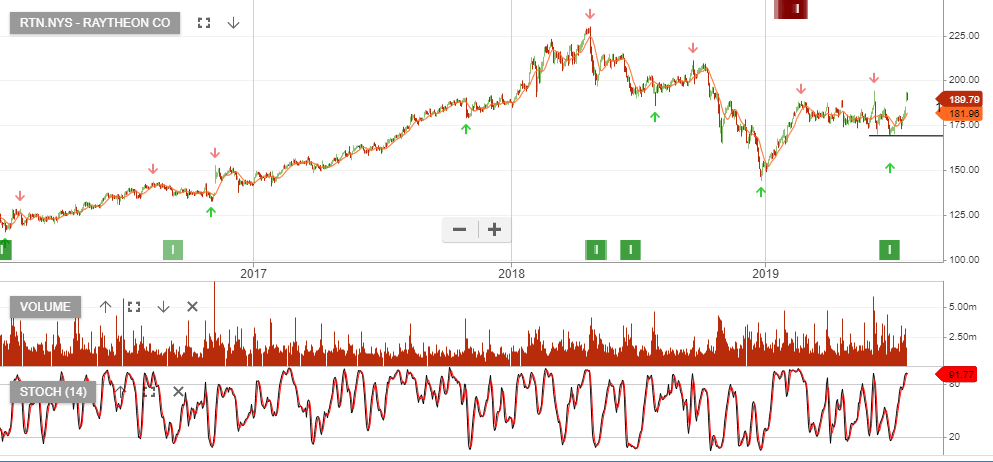
Raytheon, (listed on the New York Stock Exchange) is now under Algo Engine buy conditions and was added into our US S&P100 model portfolio, prior to last week’s earnings result.
Raytheon is a major U.S. defense contractor and industrial corporation with core manufacturing concentrations in weapons, military and commercial electronics. In 2020 the company will merge with United Technologies and we anticipate the merger will help unlock value for shareholders and underpin the growth story for many years to come.
The stock trades 19x earnings and a 2 % dividend yield. A combination of the upcoming merger and the large scale of future share buybacks has Raytheon on our “high conviction” buy list.
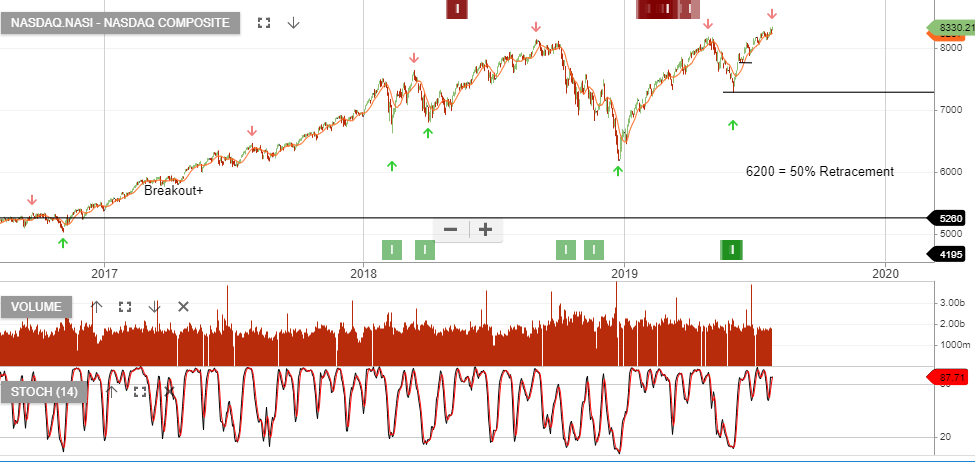
The NASDAQ index is under Algo Engine buy conditions following the higher low in May. Since the signal was generated, the index has rallied 15% and remains the only major index still under buy conditions.
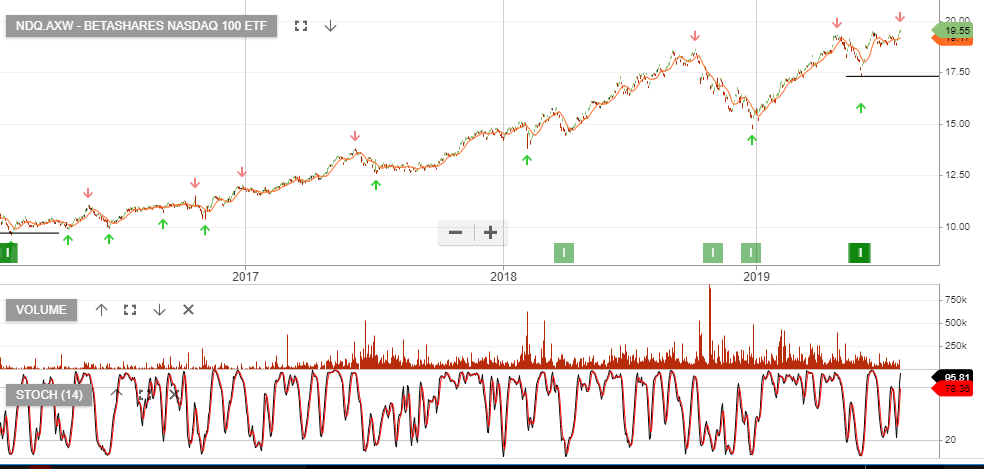
The instrument to take advantage of the above trade is best represented in the Betashares Nasdaq 100
Global markets are in the early stages of rolling over, as a combination of weaker data from China, Europe and the US weighs on investor confidence.
The U.S. economy added just 20,000 jobs last month, marking the weakest month of job creation since September 2017. Economists polled by Dow Jones expected a gain of 180,000.
Data out of China showed its exports slumped 20.7 percent from a year earlier, far below analyst expectations and wiping out a surprise jump in January.
The European Central Bank slashed its growth forecasts for the euro zone and announced a new round of policy stimulus.
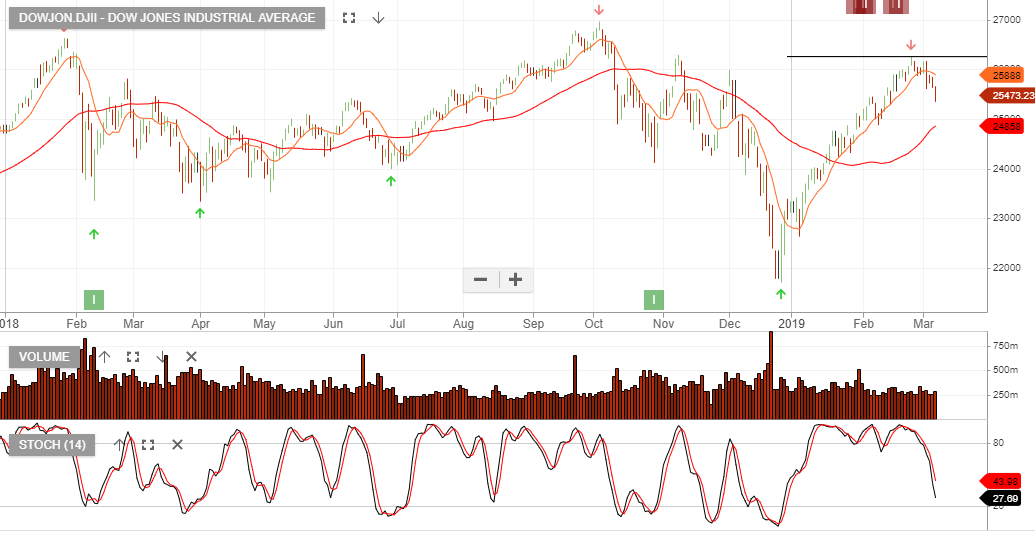
As readers will be aware, we’ve been tracking the XJO to break the 10 day moving average as a confirmation of the short-term indicators supporting the longer-term Algo Engine “sell” signal. If we apply the same analysis to the Dow Jones, we see a more advanced break in price action.
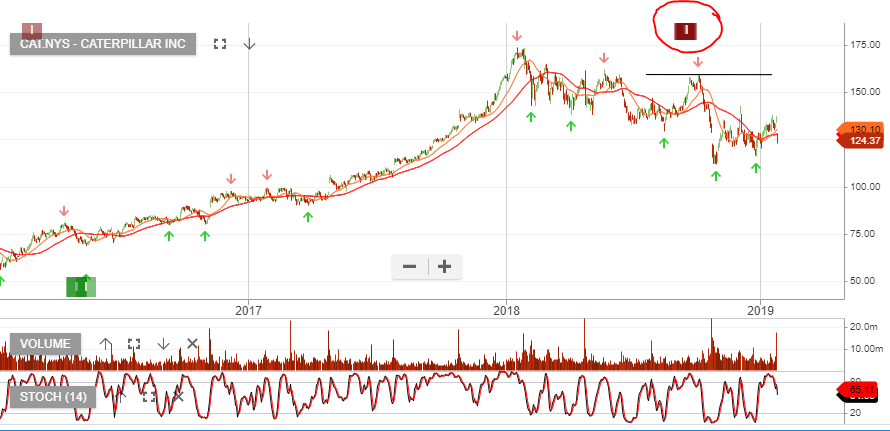
Caterpillar was removed from our US model portfolio back in September last year. The lower high formation was punctuated last night following the weaker-than-expected quarterly earnings guidance.
The company pointed to tariffs and a slow down in China as major factors in its disappointing fourth-quarter result.
Revenue for the quarter was up 11% to US$14.34bn and adjusted earnings came in at US$2.55 per share.
Caterpillar said it now expects 2019 profit to increase to a range of $11.75 to $12.75 per share.
The results were largely below street estimates, which explains the 9% sell-off in the stock.
We’ll wait for the next Algo Engine buy signal before building a new position in CAT.
Starbucks, (NASDAQ listing), was added to US 100 model portfolio in December at $61.
Shares in Starbucks are now trading at $66 after the company reported better-than-expected sales and earnings growth.
It also expects revenue to grow by 5 to 7 percent during fiscal 2019.

Investor Signals now offers US equities and if you’d like our assistance in building a US blue-chip portfolio, please call 1300 614 002.
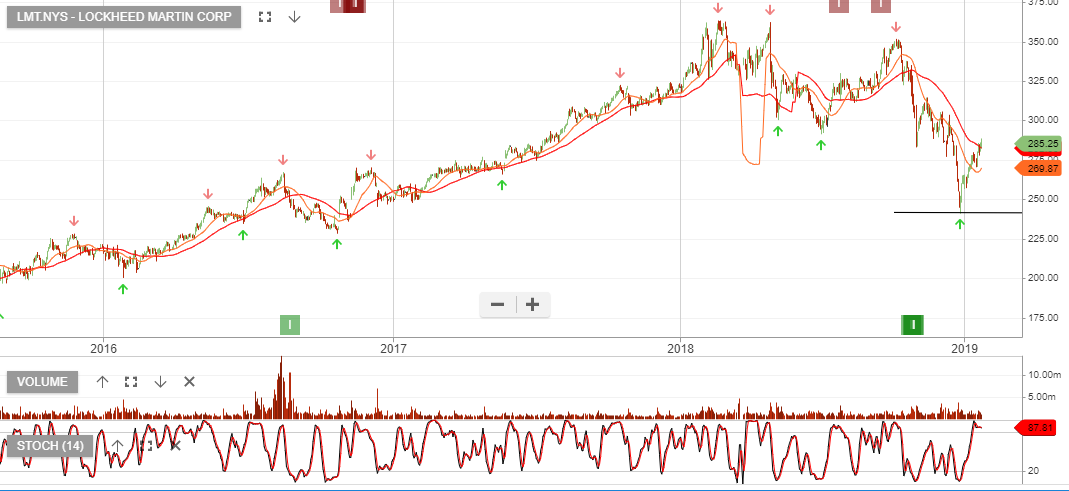
Another US blue-chip we’ve been buying is Lockheed Martin (NYSE: LMT).
LMT declared a quarterly dividend of $2.20 per share. The dividend will be payable on March 29, with an ex-dividend date of February 28. The annual yield is 3.1%.
Our Algo Engine generated a buy signal and we added LMT to client accounts at $260.
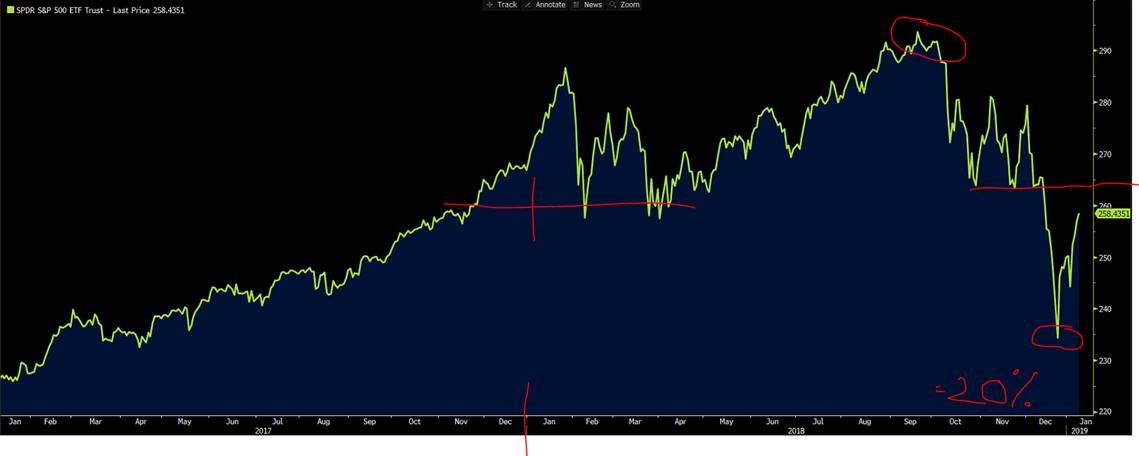
A very mild word of caution… US equities have rebounded from the December sell-off and we’re now approaching the 50% retracement mark.
As US earnings get underway for the Dec quarter, we’ve seen bank earnings in-line with consensus. Towards the end of next week, we’ll begin to see large multinational industrial companies report. It seems plausible, that markets could see some level of resistance begin to build.
The graph below shows the 2 year history of the S&P500.
This month was the best August for the NASDAQ index since the Dotcom bubble 18 years ago.
Both the SP 500 and the DOW Jones 30 indexes posted their best August performances since 2014.
More specifically, Apple shares gained 20% and Amazon shares rose 12.5% during August. Together, these two names accounted for 25% of the entire NASDAQ gain last month.
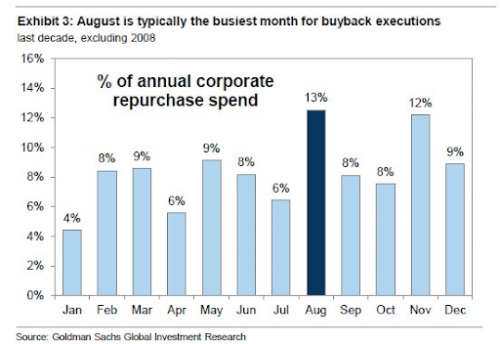
It’s worth noting that share buyback programs for US listed stocks have increased over the last three years and are on track to reach $800 billion this year.
As illustrated in the chart below, August is usually the busiest month of the year for repurchasing stock and the pace drops off during September and October.
With US stocks at record highs and the local ASX index near a 10-year high, we urge investors to approach the market with caution at the current valuations.
Using our ALGO engine, we employ technical indicators to identify stock specific opportunities across a broad market spectrum during all market conditions .
Give us a call on 1-300-614-002 to discuss our current model portfolio holdings.
Over the next month we will run a special coverage segment on US stocks and review the performance of recent Algo Engine buy signals within our S&P100 model.
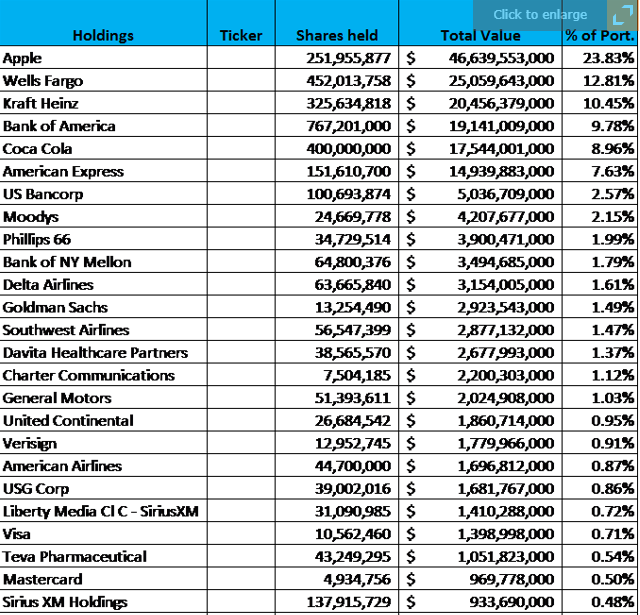
To kick-off, what better way to start than looking at Warren’s portfolio?
Here are his top 25 holdings…
Bank of America reported a 34% rise in first-quarter profit last night, topping Wall Street estimates, as the bank benefited from higher interest rates and growth in loans and deposits.
However, BAC under-performed in fixed income, currency and commodities (FICC) trading because of a decline in bond issuance from corporations.
Trading revenue was up only 1%. Equities trading revenue, excluding items, rose 38%, while revenue from trading fixed income fell 13%.
BAC’s trading results mirrored those of rivals JP Morgan and Citigroup; revenue from stock trading rose at both the banks, but weakness in bond trading crimped total trading revenue growth, which is why their share prices remain soft.
To a large degree, the local banks face the same headwinds but with the added risk of the Royal Bank commission.
Hearings from the commission are back on this week with QBE and SUN included in the questioning over insurance related business practices.
Our ALGO engine triggered a sell signal late last year in both QBE and SUN at $10.40 and $14.05, respectfully.
We remain cautious of the local banking names and see the risk continue to be skewed to the downside, especially in the regional names like BOQ and BEN.
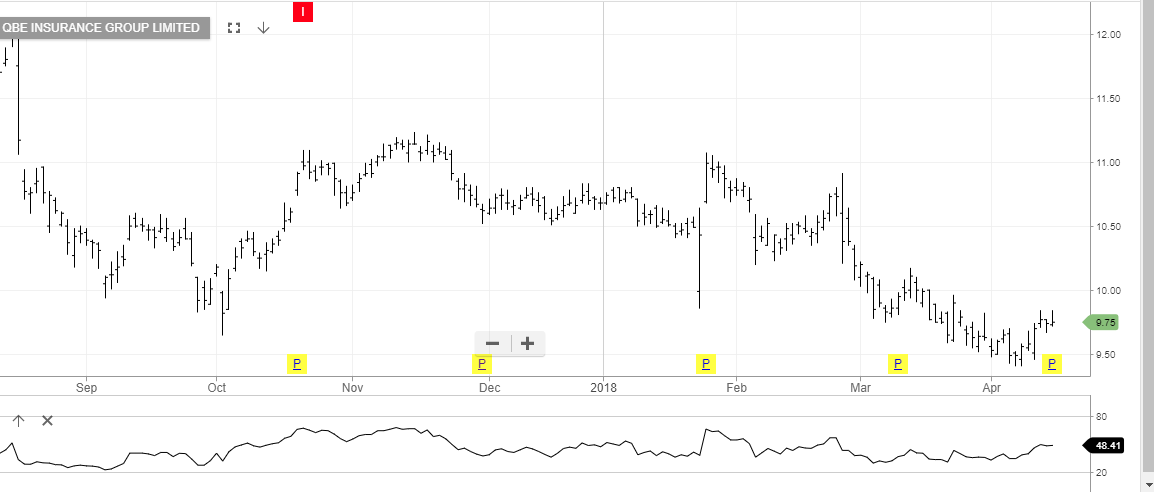
QBE
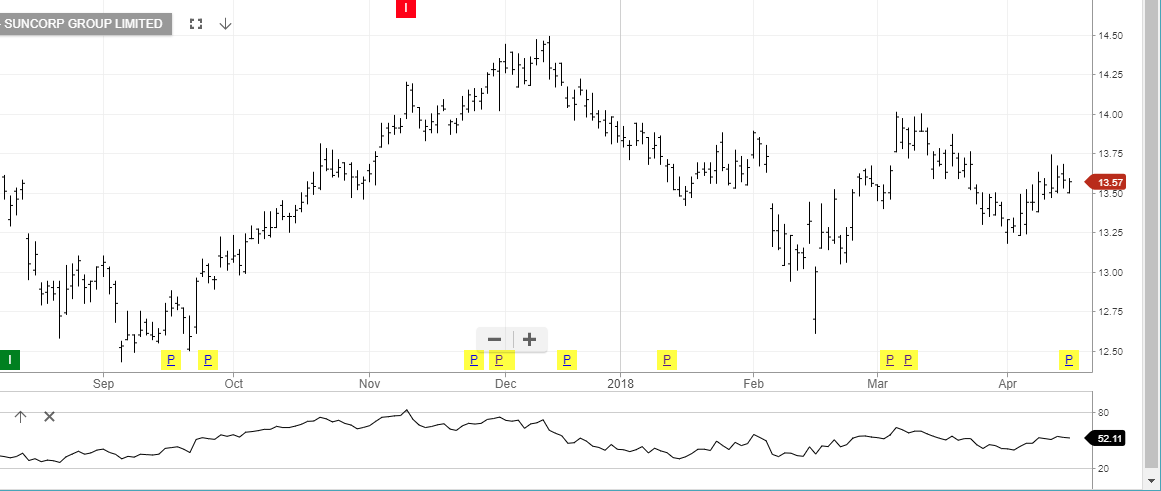
SUNCORP
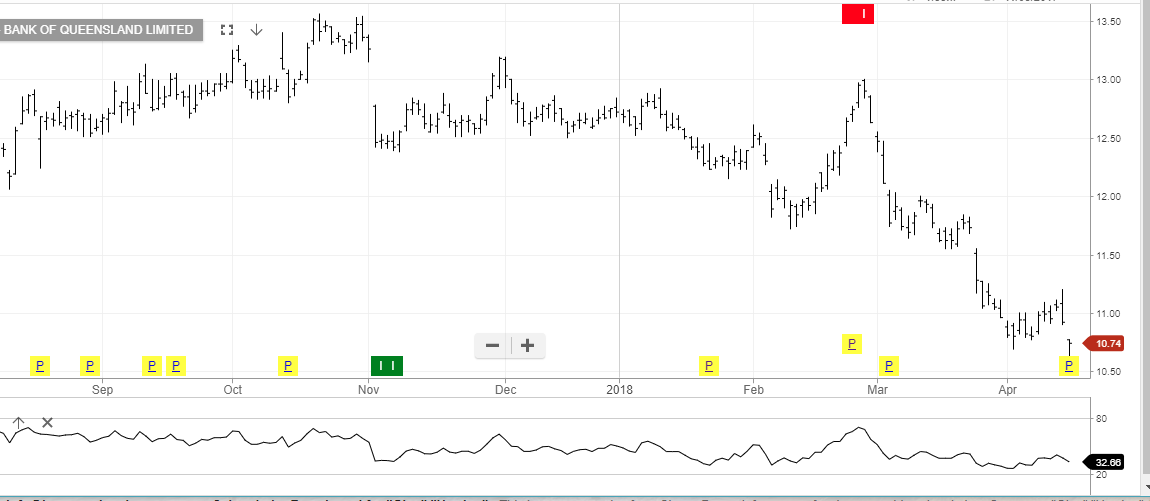
BoQ
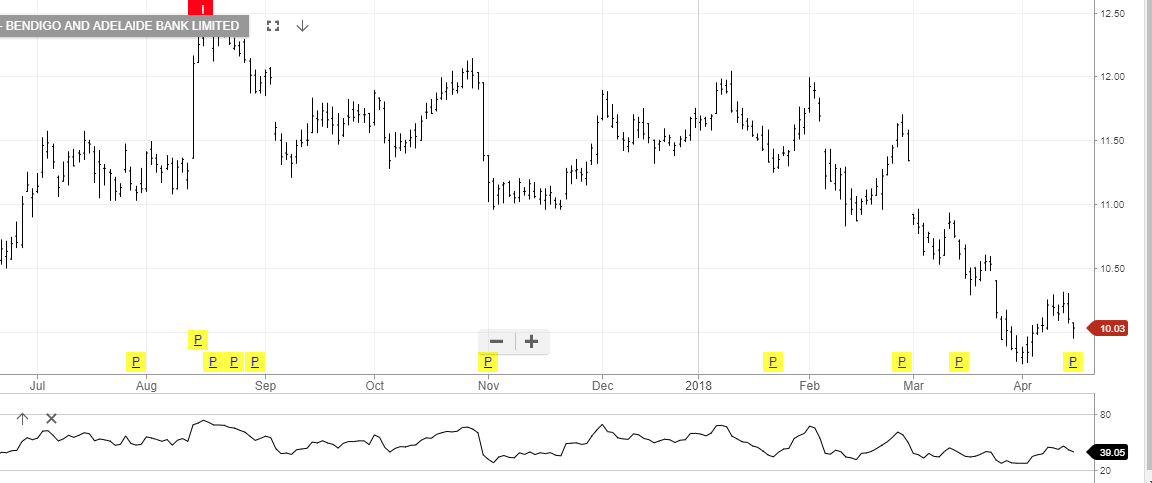
Bendigo Bank
Level 17 Chifley Tower
2 Chifley Square
Sydney, NSW 2000
1300 614 002
Investor Signals Pty Ltd
ABN 44 143 555 453