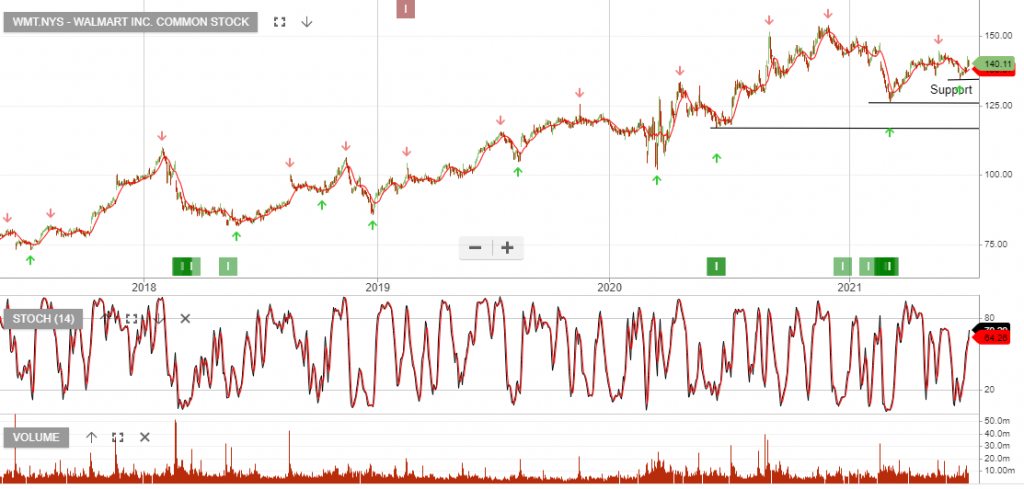
Walmart – Algo Buy
Walmart Inc. Common is under Algo Engine buy conditions.
We’re increasing our exposure to Walmart heading into the June quarter earnings result.
Walmart Inc. Common is under Algo Engine buy conditions.
We’re increasing our exposure to Walmart heading into the June quarter earnings result.
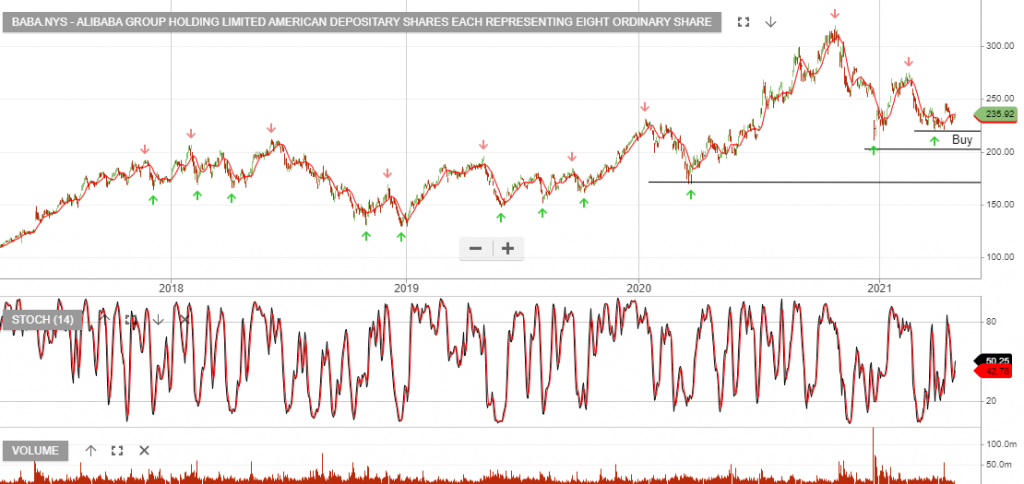
Alibaba Group Holding Limited American Depositary Shares each representing eight Ordinary is under Algo Engine buy conditions.
Alibaba is finding buying support above the recent $205 low. We expect the earnings picture to improve over the next 12 months as a result of the regulatory impacts subsiding.
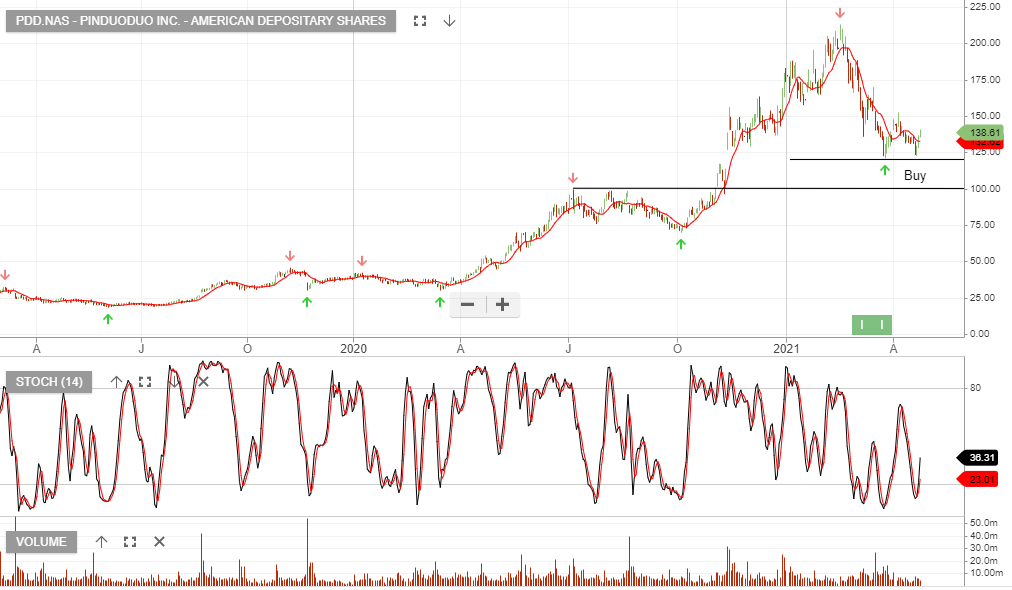
PDD:NAS is now under Algo Engine buy conditions. The company is China’s largest agriculture and interactive commerce platform.
Pinduoduo has surpassed Alibaba as China’s largest e-commerce company with 788 million active users according to its latest quarterly earnings report.
We expect buying interest to build above the $125 support level.
Q121 earnings showed continued growth with revenue increasing 239% to 22.2 billion yuan ($3.4 billion) in the three months ended March, beating consensus analyst estimates.
The number of annual active buyers for the 12 months ended March increased to 823.8 million, making Pinduoduo the most widely used e-commerce platform in China.
Alibaba is finding buying support above the recent $220 low.
PDD:NAS is now under Algo Engine buy conditions. The company is China’s largest agriculture and interactive commerce platform.
Pinduoduo has surpassed Alibaba as China’s largest e-commerce company with 788 million active users according to its latest quarterly earnings report.
We expect buying interest to build above the $125 support level. Q121 earnings should show continued growth.
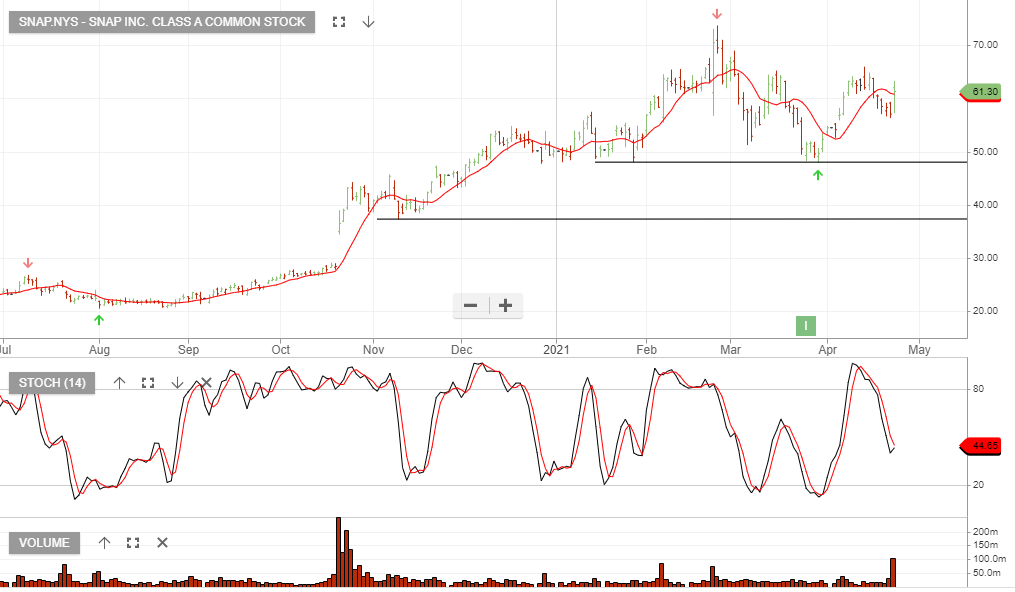
SNAP:NYS is under Algo Engine buy conditions following the entry signal at $48 in late March.
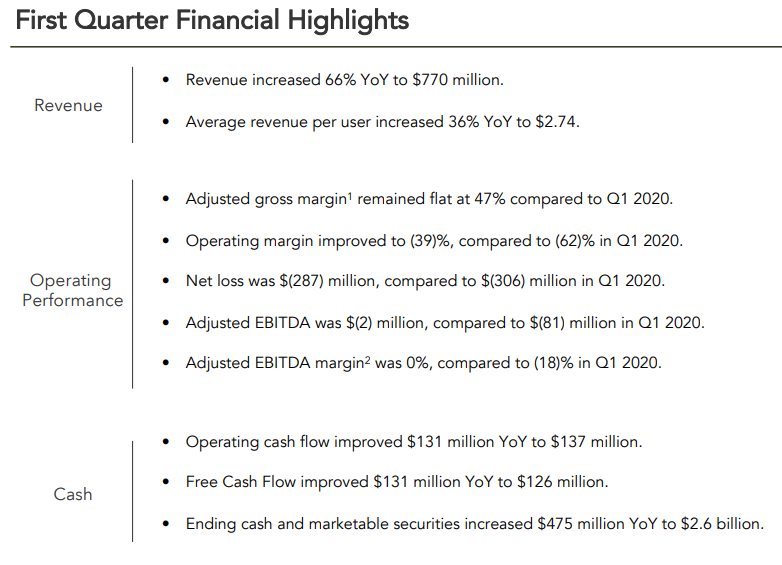
The stock price jumped a further 7.5% in Friday’s session, after the company reported accelerating revenue growth and strong user numbers during the first quarter.
Q2 2021 Outlook
Revenue is estimated to be between $820 million and $840 million, compared to $454 million in Q2 2020.
Adjusted EBITDA is estimated to be between $(20) million and break-even, compared to $(96) million in Q2 2020.
PDD:NAS is now under Algo Engine buy conditions. The company is China’s largest agriculture and interactive commerce platform.
We expect buying interest to build above the $125 support level. Q121 earnings should show continued growth.
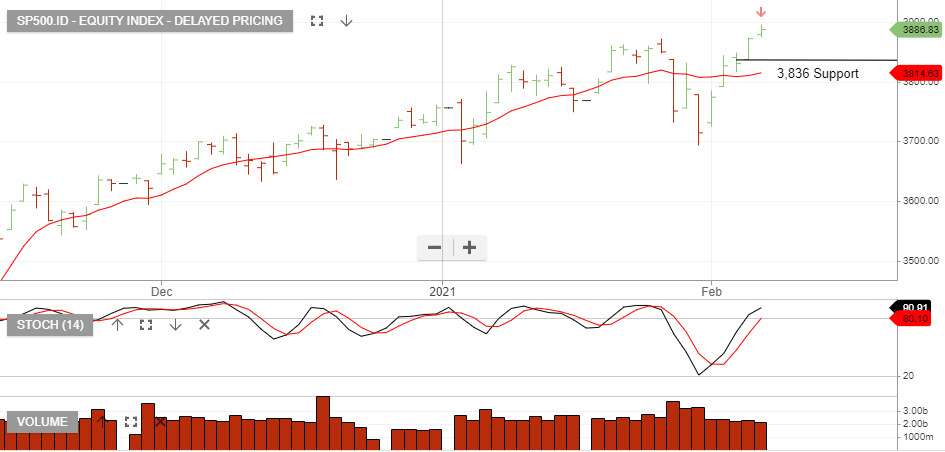
The recovery in the U.S. labor market appeared to stagnate for a second month, as non-farm payrolls increased by just 49,000 and December’s figure was downwardly revised to show 227,000 job losses, strengthening the case for further stimulus.
A break below 3,856 in the S&P500 will be negative for the momentum traders.
Level 17 Chifley Tower
2 Chifley Square
Sydney, NSW 2000
1300 614 002
Investor Signals Pty Ltd
ABN 44 143 555 453