US Market – Leading Indicators

We’ve been watching the rollover pattern in GE and the recent break of price support in Goldman Sachs as potential leading indicators. We now add UPS and FedEx as two additional stocks of interest.

FedEx Corporation is expected to report earnings in March. The report will be for the fiscal quarter ending Feb 2017. The consensus EPS forecast for the quarter is $2.62 whereas, EPS for the same quarter last year was $2.51.

United Parcel Services, (UPS), reported quarterly earnings and revenue that missed Wall Street’s expectations. Fourth-quarter earnings of $1.63 per share on revenue $16.93 billion and weak 2017 guidance, ($5.80 to $6.10 per share), has resulted in heavy sell-side pressure in the stock.

A point of note: In 2016, UPS re-purchased 25.5 million shares for about $2.7 billion.

The graphs below show a concerning trend of downside risk.

Chart – FedEx

Chart – UPS


Facebook Q4 Earnings

Shares of Facebook traded to an all-time high of $137.00 just after posting better-than-expected Q4 earnings and revenue results.

The social media giant announced adjusted EPS of $1.41 per share on quarterly revenue of $8.81 billion. These numbers exceeded the street’s estimates of $1.31 per share on revenue of $8.532 billion.

In addition, Facebook announced that Daily active users increased 18% year-on-year to 1.23 billion, while monthly active users grew 17% to 1.86 billion.

However, during the earnings call, CFO, David Wehner indicated that expenses will increase in 2017.

Chart – Facebook

Exxon Q4 Results

Shares of Exxon Mobil hit a 4-month low of $83.10 after the company missed Q4 earnings and revenue expectations.

The company announced earnings of 41 cents per share on revenue  of $61.1 billion. This compares to expectations of 70 cents per share on revenue of $61.4 billion.

The year-over-year data was mixed as Exxon earnings fell from 67 cents per share, but revenue rose from $59.8 billion against this time last year.

An upstream asset impairment charge of $2 billion, related to dry gas operations in the Rocky Mountain region, impacted Q4 as well as full-year earnings.

From a technical perspective we’re in a lower high structure with the next significant level of support near $80.00

Chart – Exxon

Apple Q1 Results

Shares of Apple are up 3% to $125.00 as Q1 earnings and revenue beat expectations. The firm also announce that they sold a record 78.4 million iPhones over the three month period.

Earnings were announced at $3.36 per share on revenue of $78.4 billion. The street was expecting earnings of $3.22 per share and revenue of $77.3 billion.

To put these sales and earnings numbers into perspective: Q1 2017  iPhone sales generated 69% of the company’s total revenue. This compares to 2.5% in Q1 2008.

One of the few negative aspects of the report was the forward guidance. The firm announced a modest cut to Q2 revenue to $51.5 billion from $53.8 billion expected.

As the market absorbs this report and lower forward guidance, we see price support back on the old resistance near $118. A break below $118 will validate our recent Algo Engine short signal. With price trading above our breakout range, we’re on the sideline for the time being with this trade.

Chart – Apple

European Economic Growth for 2016

European economic growth for 2016 rose to  1.7%. Inflation is running at  1.8%, which is nearing the ECB’s target of 2% and the jobless rate fell to 9.6%; the lowest figure since May 2009.

This is the first time since 2008 that we’ve seen EU growth prospects tracking near the rate of the US. By any comparison, the economic recovery in G7 countries is still at very low levels and fragile global conditions remain.

Equity market valuations are stretched, and subdued revenue growth will likely lead to analysts’ EPS targets being reduced by 50% for 2017 to reflect actual current growth rates.

Our Algo Engine triggered a short signal in the iShares Europe ETF back in May at $55.75 and the index collapse by 18% within a few months following. Six months on and the index has recovered back to $52 and whilst we don’t have a new short signal present, we’re still cautious that another near term top is now in place.

Chart – iShare ETF (Europe)

SP 500 Technical Picture

The SP 500 index is at a critical juncture based on two technical price indicators. The daily chart shows that the 30-day moving average (2265.00) has now converged closely to the Daily Parabolic switch point (2263). The low of the day in the SP 500 futures today was 2263.25.

The significance of this convergence is that it often time signals a change in medium-term directional momentum. In this case, the SP 500 hasn’t posted a close below the 30-day moving average since November 7th at 2130.00.

Considering how the SP 500 price has now extended beyond forward expectations of inflation and 12-month EPS levels, a decisive break of 2263.00 will likely trigger range extension to the downside. The December 30th low of 2225.00 is the first level of downside support.

US Markets – Dow Jones Index Leaders

Goldman Sachs was down 2.5% overnight and was among the worst performers within the Dow Jones index of 30 companies. We see support at $230 and resistance at $245. As a gauge to the likely direction of US financials over the March quarter, we think it’s worth keeping an eye on the directional break of Goldman Sachs trading range.

Chart – Goldman Sachs

We’re also watching the negative lead from General Electric as the stock trades 10% below the recent high formed on the 20th of December.

Chart – GE

S&P500 earnings need to grow by 10 – 12% over the next 12 months to support the Dow Jones at 20,000. If average EPS tracks at the same rate achieved in 2014, 2015 & 2016, of approximately $120 per share, an argument could be made that the true value for the Dow Jones sits back at 16,500 to 18,000.

Chart – Dow Jones

US Gross Domestic Product (GDP)

US Gross Domestic Product (GDP) for the forth quarter of 2016 came in at 1.9%, reinforcing the stagnation in the US economy.

The December quarter GDP is the fifth out of the past six quarters where GDP has come in under 2%. This may help to explain why US companies are struggling to grow top line revenue.

We’re about two thirds through the reporting season for S&P500 companies, so far earnings appear to be growing at around 6%, which is 50% below the markets bullish expectations for 2017.

Looking ahead, we remain cautious of both the March GDP reading and in particular, the S&P500 March quarter earnings, (reported in April).

An area of concern when we get to the March numbers will be the US financials. The large jump in earnings among leading US trading firms in the December quarter from bond trading, will unlikely be repeatable in the March numbers.

Bond volatility in the March quarter will probably be less than December, therefore, resulting in lower levels of trading income. Furthermore, we’re beginning to see signs that mortgage repricing is starting to negatively impact housing starts. This was evident in the December new home starts data, which showed a 10% fall.

Correlation – USD & US 10-year yield

With the USD struggling to move higher as 10-year bond yields move back over 2.50%, some market commentators are calling the USD rally over. We don’t necessarily agree with that assessment but we do recognize that the USD/10-year yield correlation has changed.

The first few days of the Trump administration has been received by the FX market with a mix of relief and fatigue. The lack of follow through on his more aggressive campaign proposals in the area of international trade has been a source of relief.

At the same time, the FX market has traded in a less sensitive pattern to the lack of consistency amongst the views of top administration officials with regard to the USD policy. The net result of the mix of fatigue and relief has been a broad unwinding of bullish USD positions  and higher volatility across the major FX pairs.

Although the USD policy hasn’t been discussed directly, it seems the new administration is willing to talk the USD down. This lingering political risk in the USD has seen a rapid breakdown in the percentage correlation between the USD and 10-year yields. 

On November 1st, the directional correlation between the USD and the US 10-year yield was 93%. This means that the USD was moving higher as US yields moved higher on a 93% correlation. However, as of this Tuesday, this correlation has dropped to just under 50%.

It’s difficult to determine how long this condition might last. Considering  two of the biggest current drivers in the FX market are policy comments from the new administration (which aren’t scheduled) and the steady increase in US equity prices, which seem to be moving further into over-valued territory.

It seems reasonable to expect in the near-term that US equity prices will correct from the recent all-time highs and 10-year yields to find some resistance in the 2.60% area. In this case, the directional impact in the USD would be a bit clearer to map. In general, when the market moves into a “risk-off” phase, the USD will firm against all G-7 pairs except the JPY.

The two key data points in the US today will be the Durable Good orders and Advanced GDP. Both of these data sets have the potential to rattle the market if they print wide of expectations. Between the two, we believe the risk with the GDP number is asymmetrical to the downside. In other words, the “risk-off” trade will be greater on a weaker print than the “risk-on” impact of as better report.
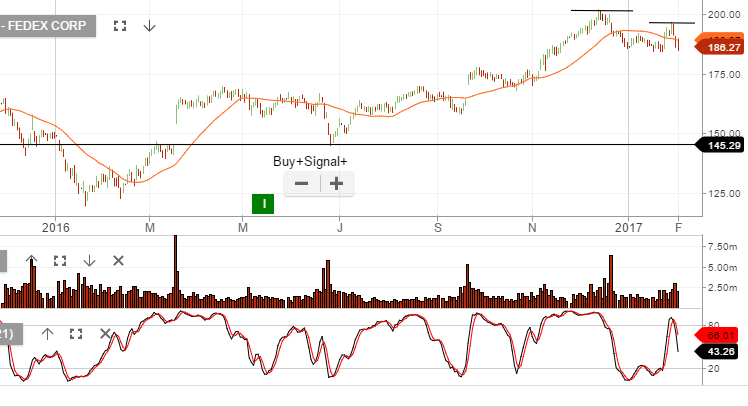
Colgate Shares Post 1-Year Low On Weak Guidance

Shares in Colgate-Palmolive had their biggest one-day drop since July 2010 on weak Q4 sales and negative forward guidance for low growth in 2017.

The company reported Q4 EPS of 68 cents per share on net income of $606 million compared to estimates of 75 cents per share.

Company sales were reported at $3.72 billion, below the year-ago number of $3.89 billion, and below the street’s estimate for Q4 sales of $3.9 billion.

The worst part of the report was the announcement that the company expects 2017 EPS to be flat and in the low single digits on an adjusted EPS basis.

Our Algo Engine generated a buy signal at or near the recent $65 low and with the weakness in the overnight earnings result, we recommend running a stop-loss on a break below 63.50

Chart – Colgate