At this point, the FED Funds futures market is pricing in a 95% certainty of an upward adjustment to the Fed Funds target and a 40% chance of another adjustment by May of 2017.
Sunday will be the Presidential elections in Austria and the Parliamentary referendum in Italy. Between these two events, it’s more likely to expect a market moving result from the elections in Austria. If the Italian people vote “No” to the constitutional changes proposed on the ballot, the worst case result is that PM Matteo Renzi will be replaced by some other non-elected technocrat designated by the EU.
However, if the Freedom Party leader, Norbert Hofer, is elected as the next president of Austria, his promises to hold a “Brexit” style referendum, combined with his general disdain for EU policymakers in Brussels, could pressure G-7 equity markets lower.
USD and US Stock indexes look technically stretched; internal volume and “breadth of market” indicators are showing signs of rolling over. It seems the slightest fundamental disruption to the current expansionary theme could trigger a pullback.
Over the last five years, one of the least important concerns for US Corporate Treasurers has been the forward cost of funding. However, over the last two months, the sharp rise across the US Treasury curve has exposed some notable differences in how banks perform versus technology companies perform in a rising interest rate environment.
Since October 1st, the yield on the US 10-year note has surged close to 90 basis points from 1.55% to 2.44%. This is nearly a 60% increase and has helped US banking stocks, while hurting some big technology names.
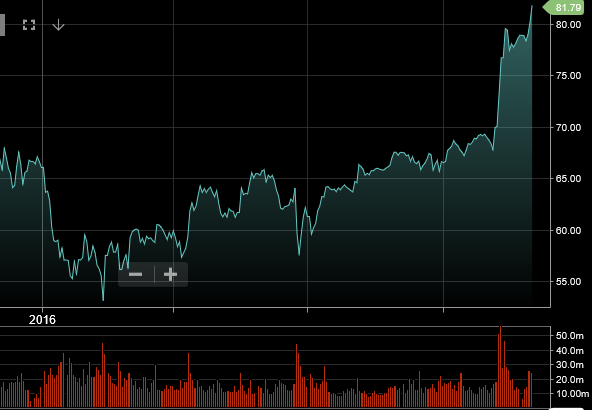
For example, Since October 1st, shares of J.P.Morgan have climbed over 20% from $67.00 per share to over $81.00 per share. During that same period of time, shares of Facebook have dropped from $133.00 per share to just under $115.00 per share; a 13.5% drop.
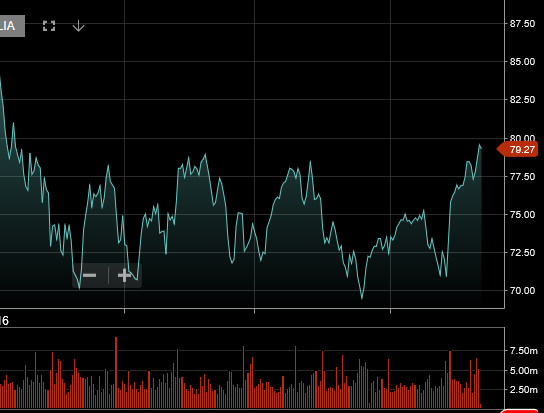
Australian consumers borrowed less in the month of October with RBA data showing private credit growth at 0.5% (5.3% year on year) versus a YoY rate of 5.4% last month. A closer look at the data suggests Australians are interested in buying real estate and not much else. Even though housing credit growth was flat last month at 6.4%, the pace is still well above the 4.4% growth in Business credit and the rate of Personal credit; which actually dropped to -1.1% Year on year. It’s likely that the growth in housing credit has been supported by the RBA’s rate cuts in May and August. However, the RBA won’t miss the fact that lending over the last 12 months has a flat to lower trajectory, which may influence their policy directives going forward.
Australian banks continue to push up against the top end of the their price channels. We’re mindful of the rally in US banks helping to boost investor sentiment towards the sector, yet there is limited evidence domestically of any pickup in earnings on the horizon.
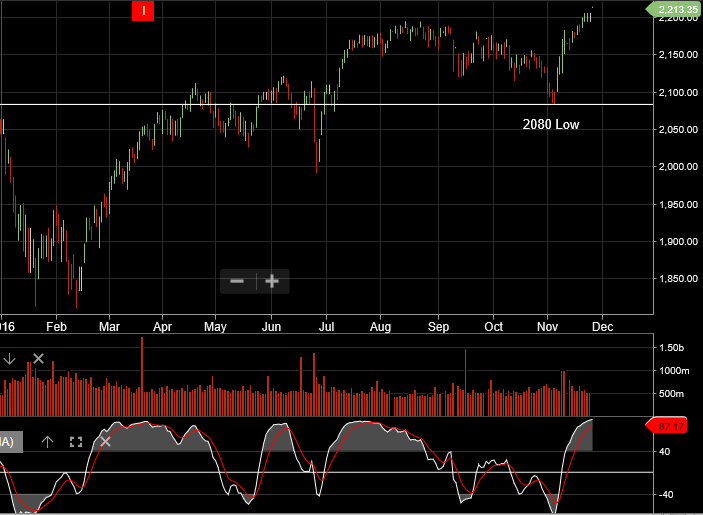
Over the last three weeks, the USD has gained more than 6% versus the Japanese Yen, nearly 4% against the Euro and USD Index has reached its highest level in over 13 years at 102.10. Further, the US SP 500 and Dow Jones 30 both pushed into new record territory. But the strong surge in the Greenback and US Stocks met resistance last Friday with the G-7 pairs closing well away from the best levels on the session. This pullback has FX strategists wondering if the US equity run is over and it’s time to sell the US Dollar.
Statistically, there is no question that the US Dollar has gotten ahead of reality and a correction of some degree is reasonable. However, it’s important to recognize that the sharp rally in the USD and US Stocks, along with surge in US Bond yields has been driven by 3 fundamental factors: position adjustments to USD and US rates, the prospects of an aggressive fiscal program from the new US administration and the expected impact of higher US inflation.
Along this line of thinking, the US FED FUNDS futures have fully priced in an adjustment higher in the FED Funds target next month to .75% and nearly a 40% chance of another 25 basis point hike by May of 2017. With the second rate hike not expected until the middle of next year, the USD and US Stocks could take another leg higher if the FOMC statement suggests that further rate normalization could come sooner.
This means that the USD correction could be swift and unbalanced across the G-7 pairs. For example, a large percentage of the USD/JPY rally has been driven by US yield spreads gaining against Japanese Government bonds. This is not the case for the sell off in the AUD and the EURO. The Euro faces a list of political and economic troubles which should keep the pair under pressure going into the end of the year. Which brings us to the Sterling; which has firmed against the USD over the last few sessions.
The GBP/USD looks to be setting up for a breakout after consolidating over the last week. The big story driving the Sterling last week was UK Chancellor Hammond’s comments about the budget. While Mr Hammond lowered his growth forecasts for the next two years, he promised more borrowing and investment into innovation and infrastructure. He also announced a new National Productivity Investment fund of £23 billion and plans to double UK export finance to make it easier for British businesses to export.
These new spending plans were not expected which pushed the EUR/GBP sharply lower and lifted the FTSE 100 to its highest close in two weeks. With respect to Brexit politics, Prime Minister May repeated her plans to trigger article 50 by march of 2017 and exit the European Union by March of 2019. As such, we believe that the Sterling will outperform the Euro, USD and the other G-7 currencies over the near-term as the USD and US Stocks correct lower.
The European Central Bank (ECB) meets on December 8th and they are widely expected to extend their asset purchases, as well as, modify their bond qualifications to expand the supply of eligible securities. With the Italian referendum scheduled for December 4th, it’s becoming very clear that the ECB’s stimulus program, and how it evolves, is changing from an economic strategy to a political necessity.
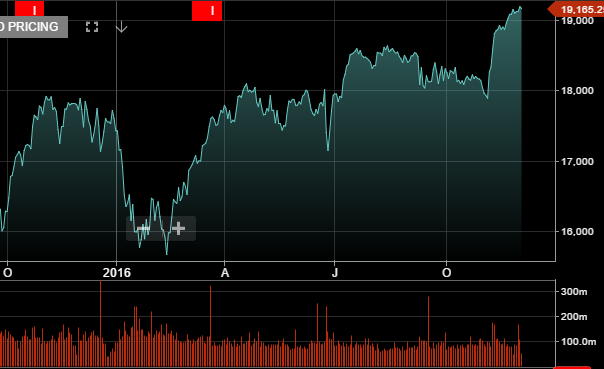
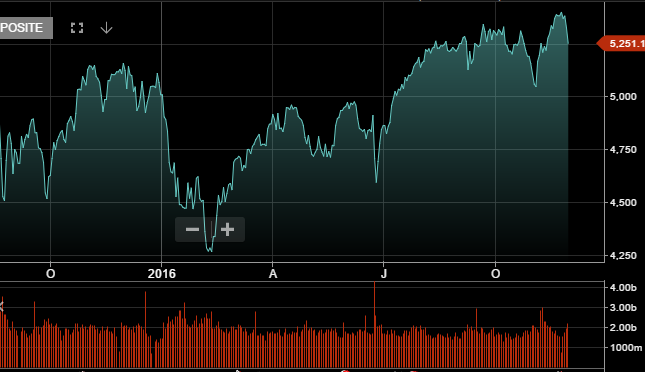
On the other side of the Atlantic, the SP 500 Index has traded sharply higher over the last two weeks. The Index has jumped to a new all-time high of 2207.00. The new administration’s commitment to tax reform, fiscal stimulus and repealing the Dodd-Frank legislation has drawn investment capital from both domestic and overseas investors.
Taking into account the Non-farm payroll data next week, followed by the ECB meeting the following week and then the FOMC meeting, we’ll be monitoring closely the momentum signals in the major global equity indices.
In the two weeks since the US Presidential elections, many global stock indexes have seen material gains with the Dow Jones and SP 500 posting new all-time highs. Notably absent from the list of sharply higher indexes is the the China Top 50 index. This index of China’s large capitalization stocks has moved higher over recent days, but is still 7% below the highs posted at the beginning of 2016.
We believe a combination of positive developments going into 2017 make this index represent good value at current levels. One of the biggest developments has been the revaluation of the Chinese Yuan to the US Dollar.
The weaker currency will have positive knock-on effects on next years earnings and lead to more robust investment demand, as well as escalating CPI/PPI inflation.
As such, several analysts believe consensus growth numbers are too low and will be upgraded between now and next March. In addition, the general top-down forecast for earnings growth has been lifted from 5.7% .
This upgrade stems from non-financial sales and profit margin assumptions based on higher nominal GDP and stronger capacity utilization.
The US Dollar has had a great month of November, so far. Not only has the Greenback gained over 5% versus the Yen and 3% versus the Euro, but the USD Index has recorded its best two-week performance in 20 years. The USD Index has traded higher for ten consecutive sessions and gained just over 4.25% to reach the highest level since 2003 at 101.25.
Investors are anticipating a very pro-business bias from the new US administration, featuring across the board tax cuts, deregulation and a comprehensive infrastructure stimulus package. However, the inauguration of President Trump is still more than two months away and it’s reasonable to expect the USD, US Stocks and US yields to take pause after the recent rallies.
Federal Reserve Chief Janet Yellen was on Capitol Hill today addressing Congress for the first time since the US Presidential election. With the USD Index pushing against a 13-year high over 101.00, it was reasonable to expect some of her testimony to address the stronger USD and the sharp increase in Treasury yields. However, these specific developments weren’t addressed and, instead, Ms Yellen expressed confidence in the progress the economy is making towards their inflation and employment goals.
She indicated that waiting too long would force the FED to tighten faster in 2017 and could spur excess volatility in financial markets, but gave no indication about the pace of interest rate normalisation going forward. On balance, her comments were hawkish enough to keep the G-7 basket of currencies under pressure against the USD, but tempered enough to lift the DOW Jones 30 and SP 500 back up into historic high closing territory.
The economic data released supported this view with housing starts and building approvals rising sharply and weekly jobless claims falling to a 40-year low at 235,000. With three other FED Governors scheduled to speak today, we could see further confirmation that US rate policy is ready to adjust higher.
With all of the bullish USD data stacking up, it’s no surprise that the EUR/USD made a new low for the year, fell for the 9th consecutive day and posted a NY close below 1.0650. It’s worth noting that only once in its 17-year lifetime has the EUR/USD gone down 9 days days in a row. That was from August 28th to September 11th, 2008 when the pair dropped for 11 days in a row and lost close to 10 big figures from 1.4810 to 1.3880. The Euro also lost more ground against the Sterling, reaching a 7-week low of .8540, which is more than 11.5 big figures below the spike high of .9695 on October 6th.
With the Fed Funds futures now showing a 98% chance of a rate hike in December, we expect the chatter from the FED Governors to remain hawkish about the December hike but somewhat blithe about the dot plots and interest rate trajectory going into 2017. It was the markets’s expectation of 4 rate hikes in 2016 which roiled global equity markets earlier this year, and it’s unlikely that the voting FOMC members will want to repeat that level of market dysfunction.
With this in mind, we expect the USD to maintain an upward bias, but with a slower pace, and for US Stock indexes to probe higher and beyond recent resistance levels.
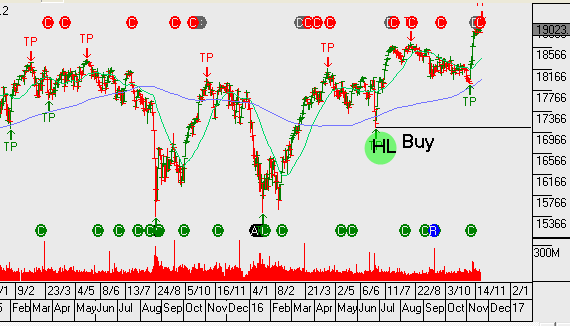
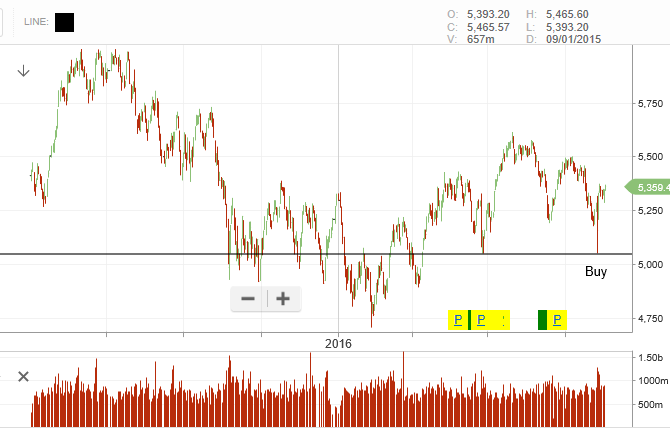
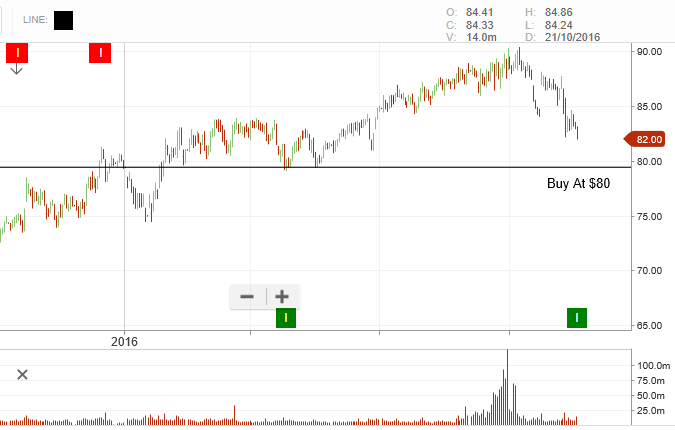
Our algo engine triggered a buy signal on Procter & Gamble (PG.NYS) overnight. We have added the stock to our watch list and look for an entry condition at or near $80
Chart – Procter & Gamble
Sophisticated Investor?
We have special opportunities available for Sophisticated Investors. If you're interested, and qualify, please provide your details below.