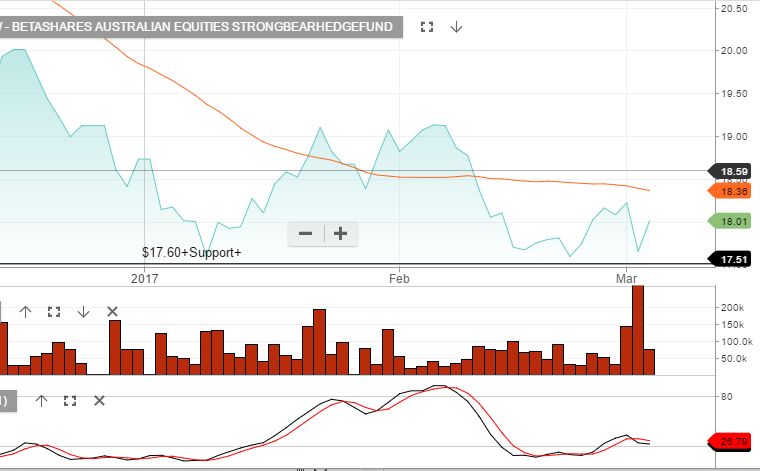
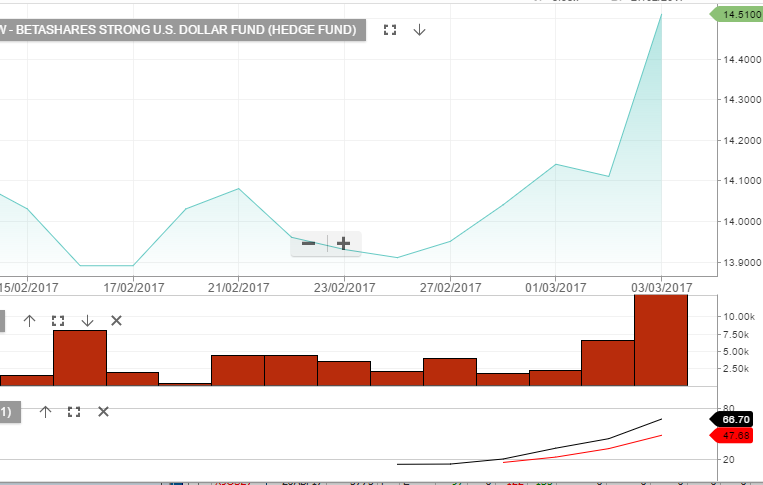
As the AUD/USD broke down through the .7600 support level, and the XJO dropped over 1% on the day, the two biggest gainers in the local ETF market were BBOZ and YANK.
The BBOZ is an ASX listed inverse Exchange Traded Fund tied to the local share market, which means the price of the shares rose over 2% to $18.05 as the shares on the XJO index traded lower.
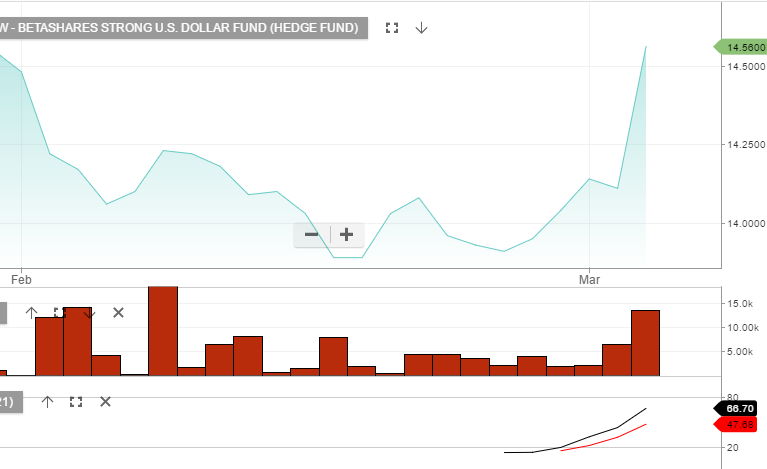
Similarly, the YANK is an inverse fund based on the price of the AUD/USD. It has a weighting of 2.5%.
As such, shares of the YANK ETF rose 3.15% to $14.60 as the price of the AUD/USD fell close to 1.5% to .7550.
In remarks earlier today, Fed President Janet Yellen indicated a readiness to raise the US funds rate at the FOMC’s March 14-15 meeting.
In fairly explicit language, she said that as long as “employment and inflation are continuing to evolve in line with expectations”, “a further adjustment of the federal funds rate would likely be appropriate”.
As a result, we now see a hike at the March meeting as close to a done deal, and see the market probability raised to 95%.
Considering the fact that the Fed Funds futures contract was reflecting a probability of around 30% just over a week ago, this has been a very sharp turn in policy sentiment.
As a result, US 10-year yields touched 2.52%; close to a 3-month high.
In typical market conditions, a US rate hike is Bullish for the US Dollar and Bearish for Stocks, Commodities and Crude Oil
US stocks pulled back from Wednesday’s records while the dollar strengthened on positive US data and growing expectations the Federal Reserve will soon raise interest rates.
XJO is under pressure from both resources and banking stocks.
The Aussie Dollar fell hard last night breaking the key support area of .7600 versus the US Dollar and closing the NY session down almost 1.5% for the day.
After consolidating for several weeks above .7650, the AUD/USD finally broke down. Although recent economic reports have been fairly good, yesterday’s weaker trade balance figures were a sharp reminder of the damage a stronger currency can do to an export dependent economy.
Analysts were looking for the January trade surplus to increase to 3.8 billion, but instead it shrank to 1.3 billion; less than a third of the expected level. The main draw on the trade balance were exports, which fell over 3% for the month.
The RBA has been clear that a stronger AUD will act as an economic headwind as Australia moves away from a mining-based economy.
Over the last 18 months, the AUD/USD has traded in a broad range between .7000 and .7750. Technically, last week’s high of .7740 could stand as a medium-term top as US Dollar strength pushes the AUD toward the bottom end of the range.
Investors looking to benefit from a move lower in the AUD/USD can consider the BetaShares AUD-based Exchange Traded Funds.
BetaShares offers two ASX-listed ETFs which increase in value as the AUD trades lower against the USD.
These two ETFs are called: USD, which is unweighted, and YANK, which has an approximate weighting of 2.5 to 1.
Contact us for more information about these AUD-based ETFs.
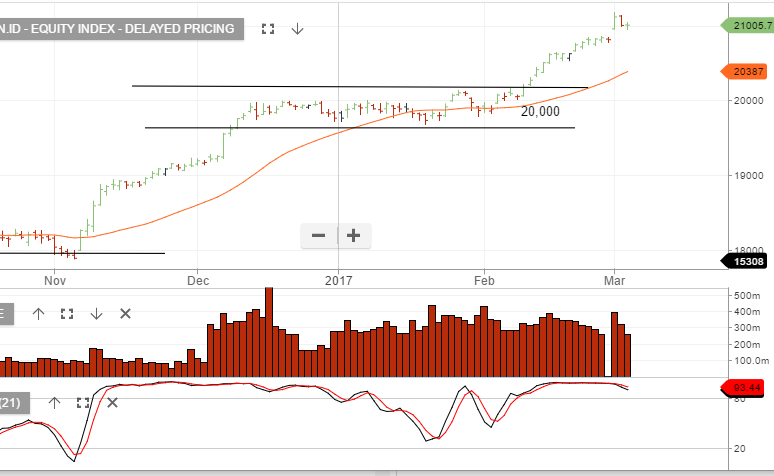
Since February 2nd, when the DOW Jones 30 index crossed above 20,000, four individual DOW components have been responsible for over 500 points of the gains which lifted the index up to today’s close of 21, 115.
These four shares are Goldman Sachs (160 DOW points), Boeing (150 points), 3M (110 points) and Apple (80 points)
Not surprisingly, these four companies stand to benefit from the three most broad policy measures from the Trump administration: Infrastructure expansion, tax reform and financial deregulation.
However, against the backdrop of today’s stock market rally, US interest rate markets are beginning to aggressively price in an increase in the Fed Funds rates at this month’s FOMC meeting.
As of last Friday, the odds that the FED would lift rates on March 15th were 30%. At the close of trade today, the odds have soared to 82% with the yields on the US 2-year notes reaching a 9-year high of 1.30%.
Much of this price increase has been prompted by comments from voting FED Governors; who have been uncharacteristically direct in their concern about waiting too long to normalise rates.
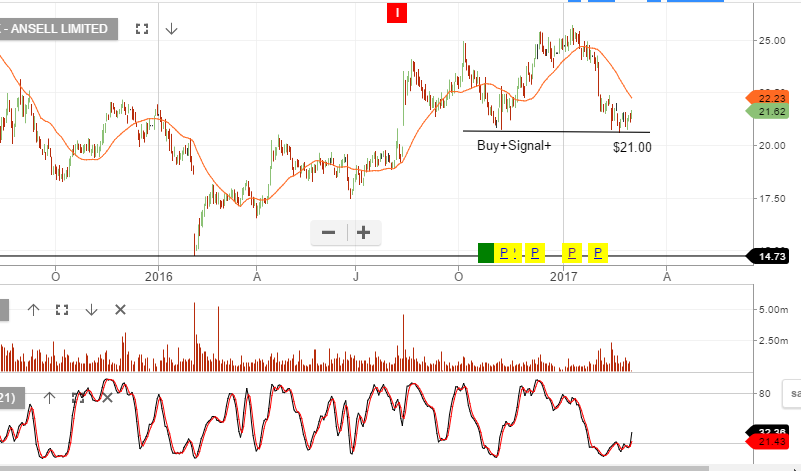
Our Algo Engine triggered a buy signal on ANN a few months back when the stock was last on the $21 support level.
With the stock retesting this level and increased buying interest occurring, we again are willing to look at ANN with a tight stop-loss under the $21 support.
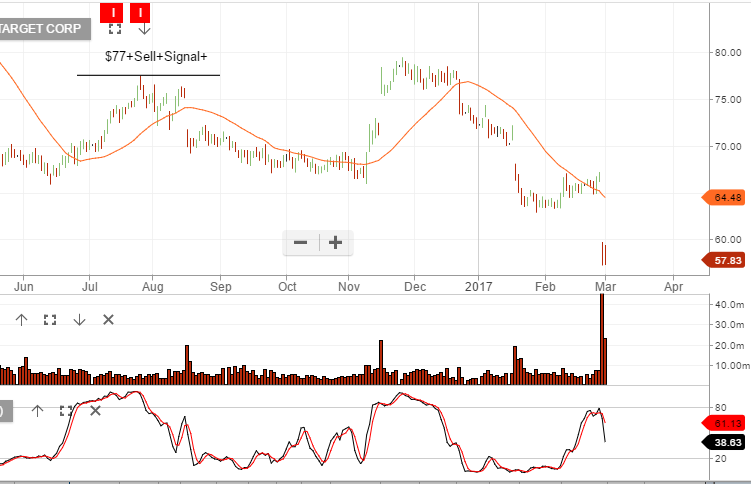
In July last year, we highlighted one of our preferred US equity short signals on the blog. Target was triggered by the Algo Engine as a short signal on the 26/07/2016 at $77.
Target is now trading $57.
Chart – Target
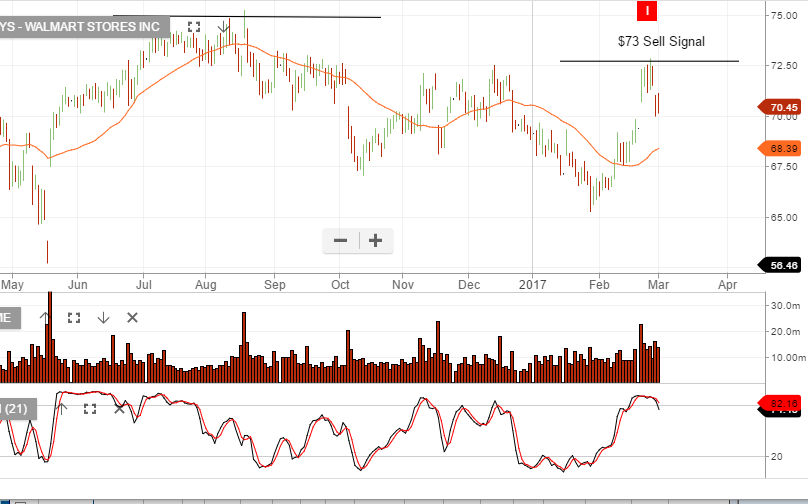
Walmart has recently been triggered as a short from $72.80.
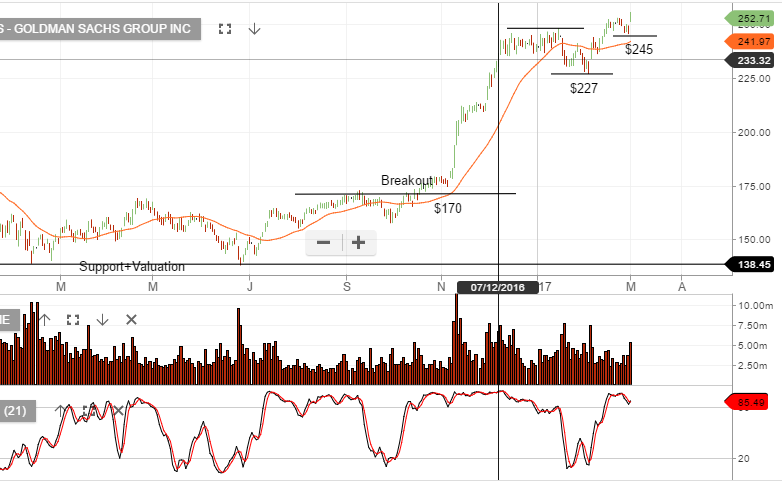
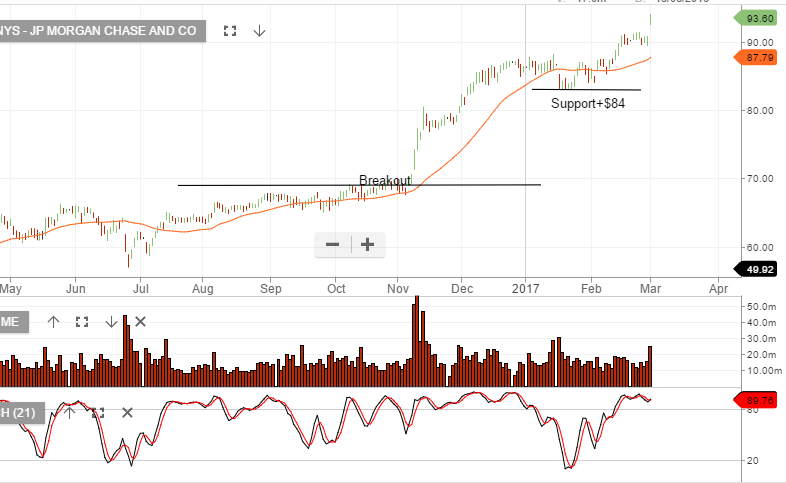
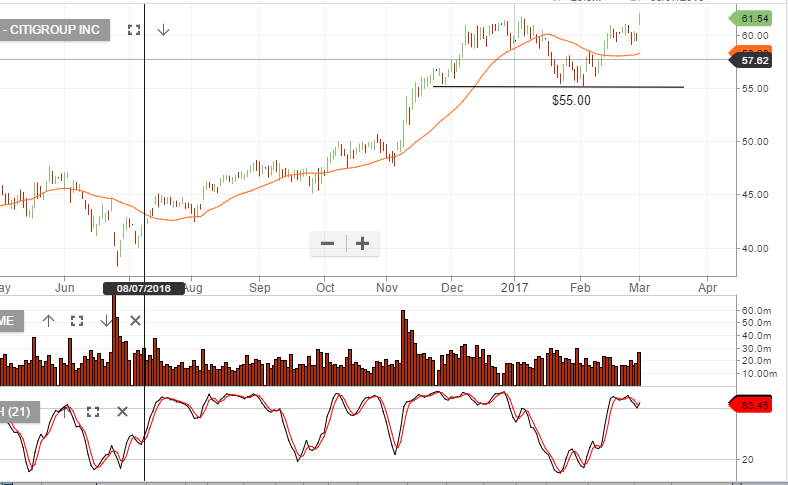
After consolidating from mid-December to mid-February, we’re now seeing US financials breakout again to the upside.
Using Goldman Sachs as a leading indicator to US financials, we form a view that it’s best to stay with the upside momentum until we see a downturn in price which takes-out the recent minor higher low at $245.
Whilst we struggle to see the EPS support for US equity valuations, momentum remains very strong. March quarter earnings to be announced in 4 weeks may provide a reason for investor’s buying enthusiasm to pause.
Chart — Goldman SachsChart – JP MorganChart – Citi Group
Sophisticated Investor?
We have special opportunities available for Sophisticated Investors. If you're interested, and qualify, please provide your details below.