Big Reversal In The FANG Stocks

Shares of Facebook, Amazon, Netflix and Google (also known as the FANG stocks) all fell over 3% today as investors pulled money out of the overheated US Tech sector.

The FANG stocks have been market leaders all year and have accounted for over 40% of the NASDAQ gains year-to-date. On a valuation basis, these names have added over $600 billion to the S&P 500 even though they only make up 13% of the index.

Many analysts have been expecting a pullback in the tech sector as P/E ratios and forward guidance data have approached the levels last seen prior to the 2000 and 2008 market corrections.

It’s worth noting as a point of reference that Microsoft, which is not a FANG stock, fell 62% after the 2000 tech bubble burst and dropped 45.5% during the financial crisis in 2008.

Even after today’s sharp decline, the S&P tech sector is still up over 18% for the year.

Trade Update……Stay Short The XJO

As ASX market participants prepare for the Queens Birthday weekend, we would like to update some of the recent market themes suggested to investors and subscribers.

Our short bias on the XJO took a little longer to develop than had hoped but now looks to be on track to hit our 5500 target by mid-July. An integral part of the technical price breakdown in the XJO has been the sell off in the major banking names.

The major banking names are all 8 to 10% off their April highs. The Government’s Levy legislation, combined with slower loan growth and loss provision numbers, has the potential to see the banks trade back to the November 2016 lows.

Many clients who were reluctant to sell their bank shares are now calmed in the knowledge that they will be able to re-establish those positions at lower levels.

In addition, investors with a slightly higher risk profile were able to profit handsomely on the bought put options as the banks traded lower.

Like the XJO trade, the long put positions in JHX and AMP are now gaining momentum to the downside. Since both of these strategies were structured as “Put Spreads”, we are looking to scale out of these positions and replace them with outright downside directional strategies over the next few weeks.


ETF Watch: Buy OOO For Mean Reversion Trade In Crude Oil

Over the last 10 trading sessions, WTI Crude Oil has dropped over 13% from $52.00 to last nights low of $45.20.

Technically, we see good support near the $43.75 area, which was the reversal low posted on May 5th.

Fundamentally, increased political tensions between OPEC members Qatar, Saudi Arabia and Iran could escalate into military engagement with some associated levels of supply disruption in the near-term.

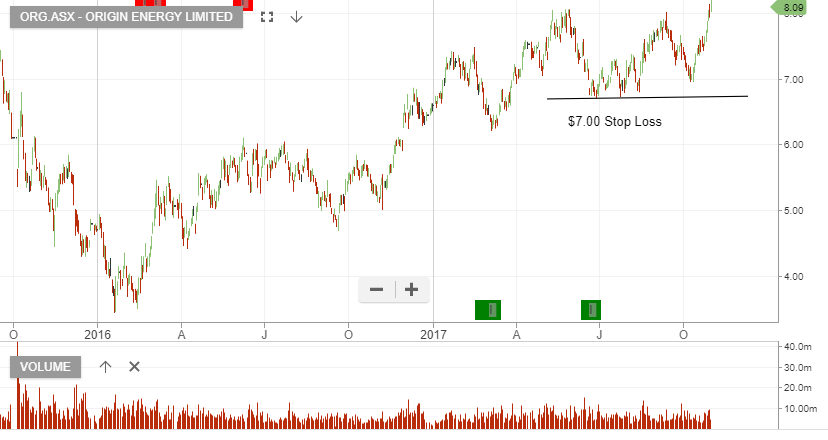
As such, we have been looking to buy the dip in some of the local energy names like Origin Energy and  Oil Search. (The ALGO engine gave a buy signal on OSH yesterday)

Further, we have also suggested that investors looking for a mean reversion higher in Crude oil prices can buy the BetaShare Oil ETF with the symbol OOO.

OOO traded as high as $8.10 just a week ago and has now in the low $7.00 area.

BetaShare Crude Oil ETF


Origin Energy

Oil Search


Amcor – Buy Write

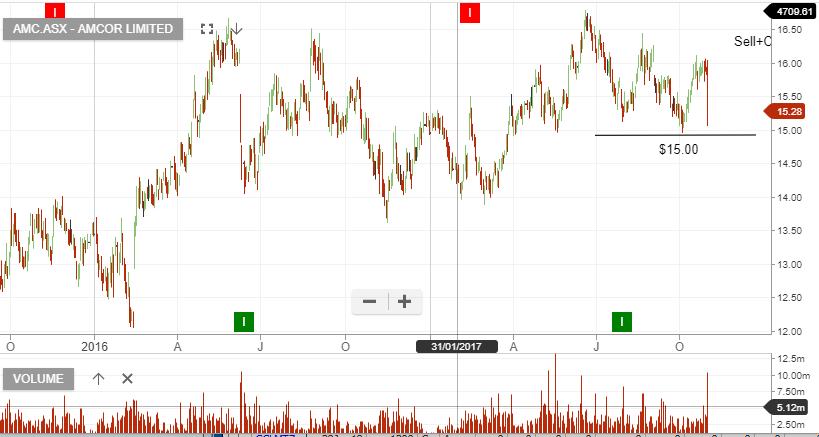
We continue to see Amcor as a solid contributor to portfolio returns, especially when complimented with a slightly out-of-the-money call option into November or December.

A combination of the dividend and call option premium produces 10 – 12% annualised cash-flow.

FY18 forecast revenue US$9.6b, EBITDA US$1.5b, Net Profit US$790m, EPS US$0.66 and DPS US$0.49 places the stock on a  forward yield of 4%.

Buy on any marginal price retracement.

Chart – AMC


A New Bullish Case For Gold

Spot gold rose to its highest levels since November near $1,295 per ounce on Wednesday, good for a 13% gain so far in 2017.

In so doing, Gold broke a technical downtrend that has been in place since the  September 2011 peak of $1,900 per ounce.

The support in the yellow metal may be evidence of market fear rather than reflationary exuberance. The Chinese Gold and Silver Society Exchange expects 2017 mainland gold imports to increase by 50% from the prior year, amidst increased safe haven demand.

Daily chart analysis points to the next resistance level near the September highs of $1,322.

We continue to accumulate shares and call options on NCM. We also suggest shares in EVN and the BetaShare Gold ETF with the symbol QAU.


Bank Stocks – Where’s Support

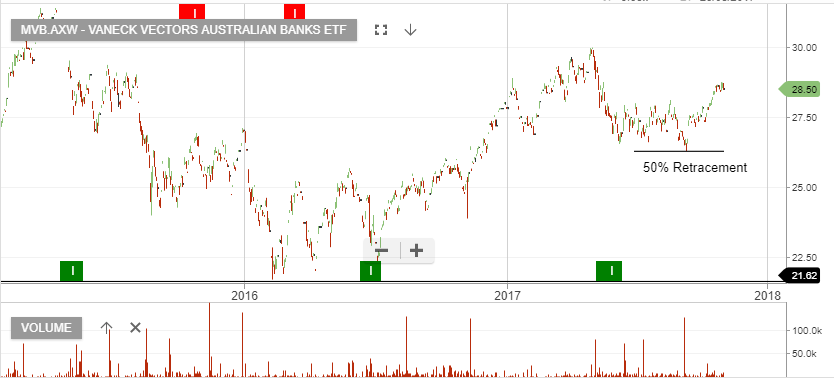
On the 30th of May we looked at the MVB Veneck Vectors Banking ETF and identified the 50% retracement target to be $26.00. Yesterday, the MVB traded at a low of $26.56.

The 50% retracement of the prior peak -to-trough does not guarantee price support.  However, more often than not, buyers will step back in at or near this point.

The conundrum facing local ASX investors is the dislocation between US equities and Australian equities.  As such, “buy on the dip” domestic investors will need to remain cautious of the extended US equity valuations.

Chart – MVB


James Hardie Support At $18.00

Regular readers will recall that we’ve had a bearish bias on JHX since it broke the $22.50 level in the early part of May.

At that time, the stock was trading at 27 times earnings on a 2.2% annual yield

A weaker US house construction market combined with a general contraction in US retail sales has kept shares of JHX offered over the last several weeks.

We maintain our downside target of $18.00 per share over the medium-term.

James Hardie