ETF Update: BetaShares BBOZ

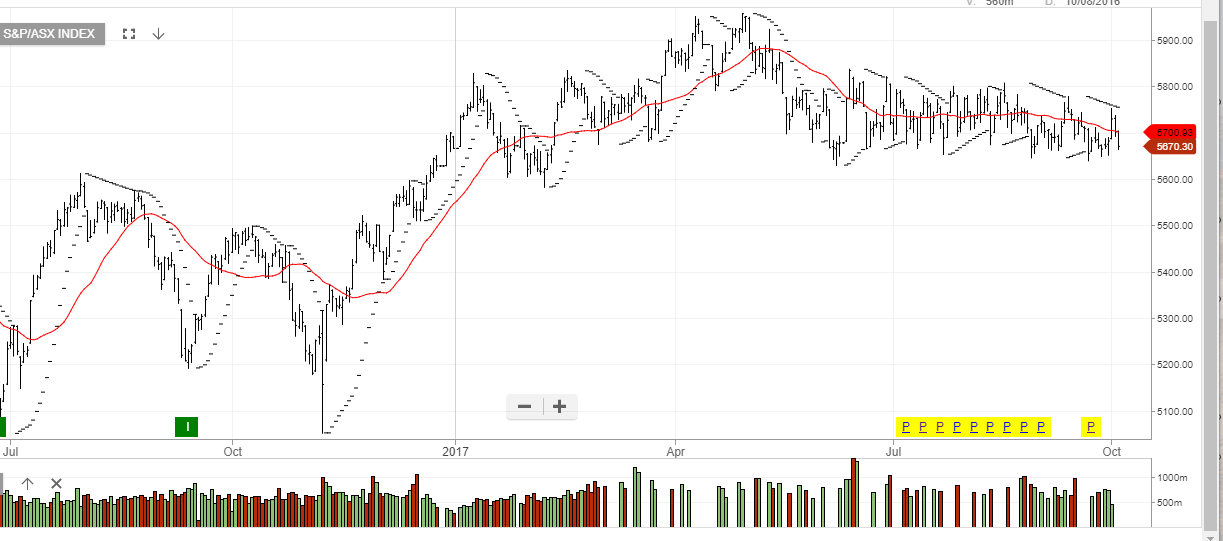
The XJO 200 Index continues to trade within a broad, sideways “Flag” pattern bound by the June 8th low of 5624 and the June 15th high of 5834.

The index is currently trading at 5666, which puts the key support level of 5624 within reach. A break of this level would open up range extension to the downside and find the next key target at 5578.

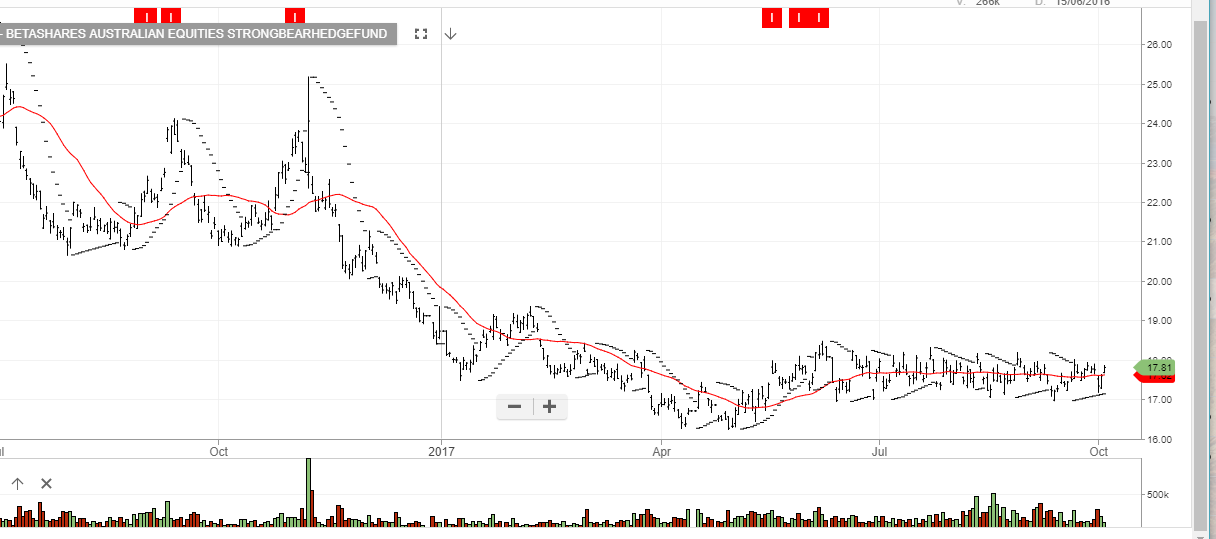
Investors looking to profit from a move lower in the XJO can buy the BetaShare ETF with the symbol: BBOZ.

BBOZ is an inverse ETF which means the unit price increases as the XJO Index trades lower.

BBOZ also has a 2.5% weighting, which means a 1% move in the XJO will have a 2.5% impact on the unit price of BBOZ.

The current price of BBOZ is $17.80.

We estimate that unit price of BBOZ will be $19.50 when the XJO trades down to 5578.

ASX XJO Index

BetaShare Inverse ETF: BBOZ


US Stock Update: Grinding Higher Into Earnings Season

US equity markets lifted for another record high across the board on declining volume.

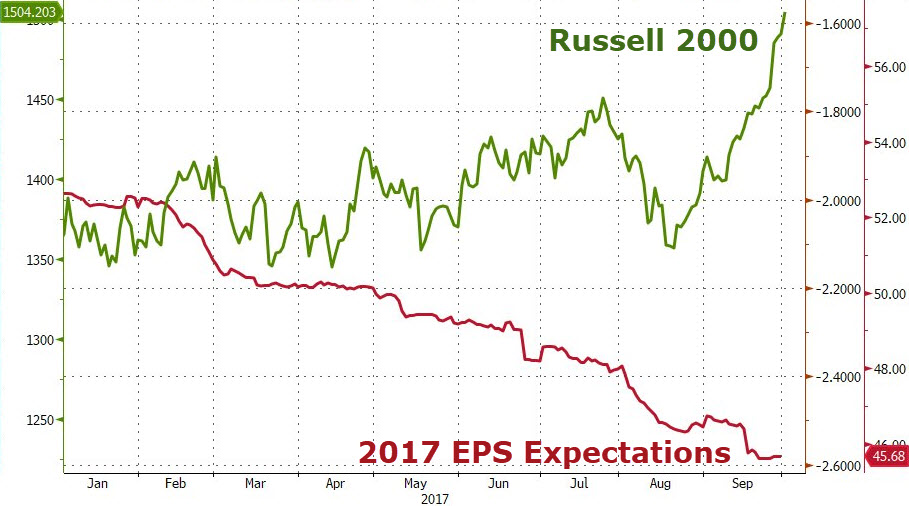
Even the broad-based Russell 2000 Index hit a fresh record of 1,512 on its eighth consecutive trading day of gains. This is the longest streak since just after the US election in November.

It’s difficult to imagine this pace will continue and equity valuations at these extreme levels remain exposed to various unfavorable surprises.

One of these surprises could come within two weeks as US earnings season begins.

As illustrated in the chart below, there is a clear and widening divergence between the Russell Index and the expected earnings per share.

Russell 2000 Index


ALGO Trade Update: Sharp Reversal In Crude Oil

The recent rally in Crude Oil reversed overnight as November futures fell close to 3% after OPEC output rose by 120,000 barrels per day during the month of September.

US drilling firms also added rigs for the first time since August, which suggests more supply coming online into the end of the year.

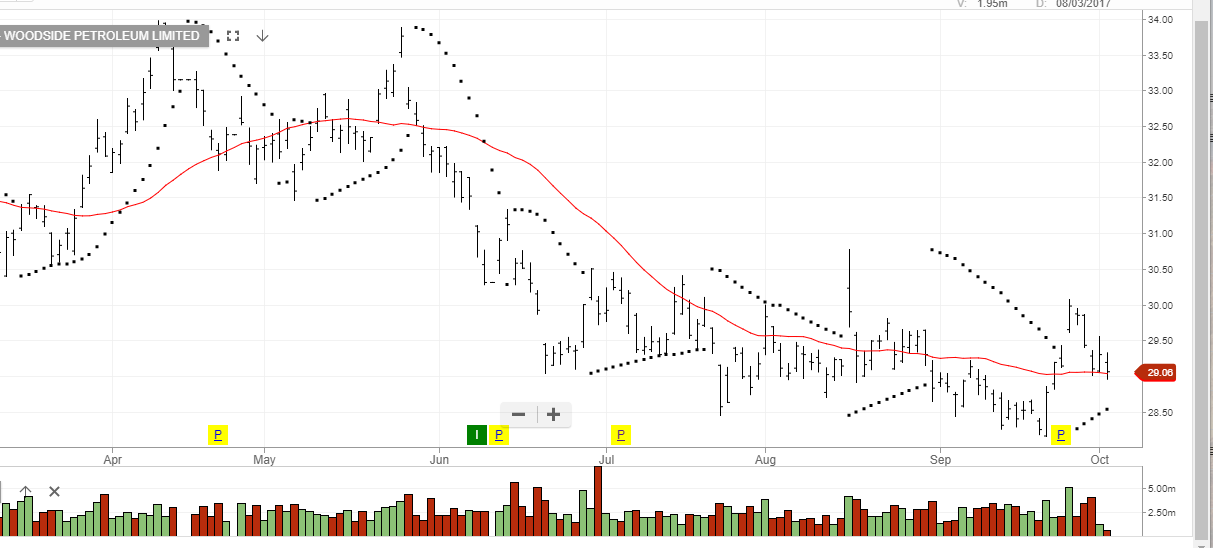
As a result, shares of local oil producers STO, OSH and WPL are all priced lower in early trade.

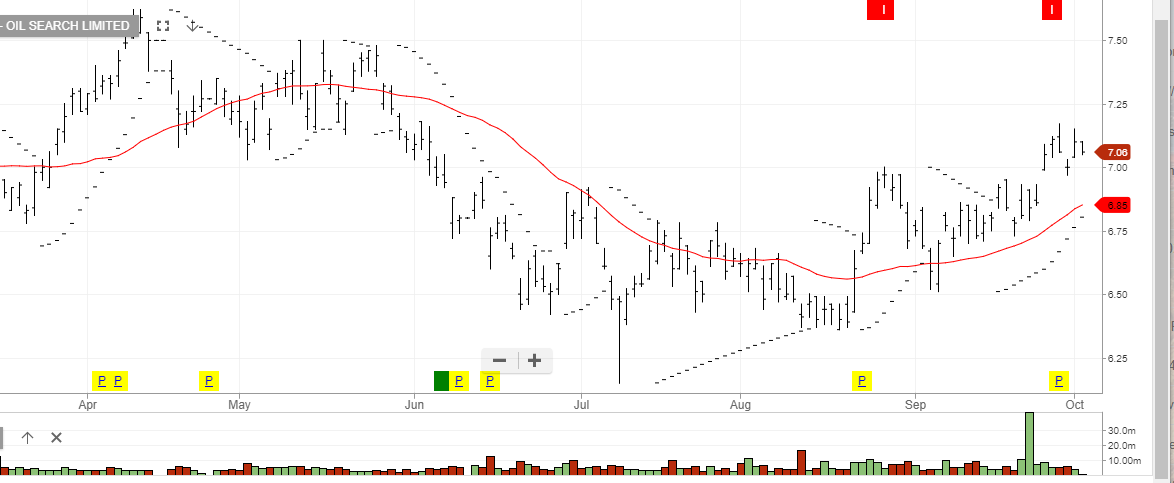
Our ALGO engine triggered a sell signal in OSH on September 28th at $7.10. If Crude Oil extends its correction lower, we would look for the next key support level near the September 9th low at $6.50.

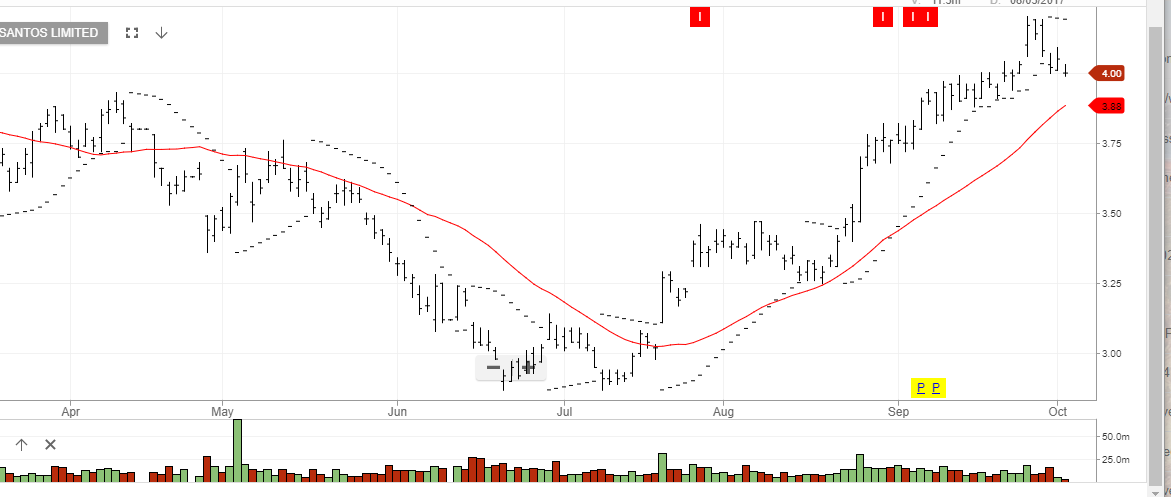
A sell signal for STO was generated on September 26th at $4.20, which is developing slowly with a downside target near the August 18th low of $3.35.

We didn’t get a sell signal in WPL, however, we would expect a break of the $29.00 level would extend down to the $28.30 level in the near-term.


Oil Search

Santos

Woodside Petroleumosh


RBA Preview: Will The AUD Get A Mention?

The RBA has left overnight rates at 1.50% for the last 14 months. The overwhelming consensus is that they will leave rates unchanged at their meeting today.

RBA chief, Phillip Lowe, has been clear that even though other G-7 central banks are planning to lift rates in the future, that is not the path for Australia.

With no expectations of an adjustment in rates, the market will focus on the board’s monetary policy statement.

Since the the RBA last met, there have been sharp falls in the prices of Iron Ore and Coal. In addition, the Chinese Sovereign credit rating has been downgraded.

Considering that the AUD/USD has traded modestly down to .7800 on the back of those developments, Mr Lowe could include comments on the level of the currency in the statement.

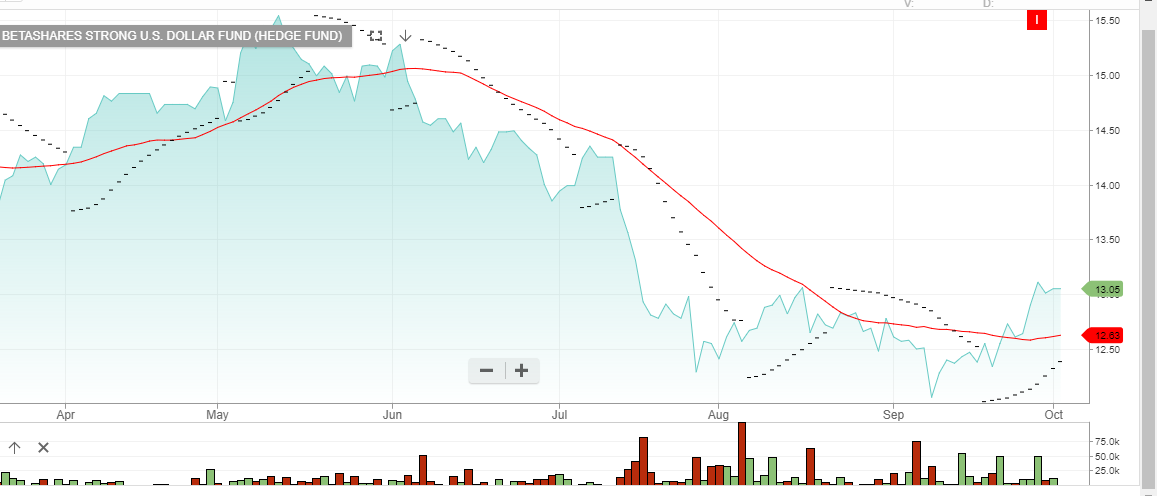
Investors looking to profit from a lower AUD/USD can buy the BetaShare ETF with the symbol: YANK.

YANK is an inverse ETF, which means the price of YANK increases as the AUD/USD trades lower. It also has a weighting of 2.5%, which means the unit price will fluctuate  by 2.5% for every 1% change in the AUD/USD exchange rate.

With a current price of $13.10, we calculate that the price of YANK will be near $16.50 as the AUD/USD returns to the January low of .7160.

BetaShare ETF: YANK


Trump’s Tax Plan: A Boom Or A Bust?

It’s almost been a year since Donald Trump was elected to the White House.
One of the key promises Mr Trump made to voters during his campaign was for the “largest tax cut” since the early 1980’s.
Not including the vague leaks over the last three months, a tangible, nine-page brief of the tax reform plan was just released last Wednesday.
Just a few of the key features of the tax plan include: lowering the corporate tax rate from 35% to 20%, dropping the number of personal tax brackets from 5 to 3 and a one-time repatriation tax, designed to bring corporate profits back from overseas.
From a market perspective, it’s the repatriation tax that has the financial media the most excited.
It’s been estimated that US multi-national corporations have somewhere between $3.5 to $5 trillion domiciled offshore. The prospect of having these funds sent back to the USA, with a maximum tax rate 10%, is very bullish for both the USD and US stocks.
At this point, the biggest question for investors is: will this tax reform plan become law and have a positive impact on US equities and the USD, or will the proposal become another victim of the political gridlock which has permeated Washington DC since Mr Trump took office?
Over the last few days that the tax proposal has been out in the public, politicians from both sides of the aisle have criticized various provisions and changes to the tax code.
As expected, core Democrats are calling the plan a tax cut for the rich at the expense of the middle class, and the small group of Republican “deficit hawks” have refused to support the changes until they are scored by the Congressional Budget Office (CBO).
In this context, “scoring” means calculating how the proposed changes to the tax code will impact the federal deficit, relative to the spending and entitlement costs allocated in the Federal budget.
In our view, it’s this last point which is the biggest hurdle to any meaningful tax reform this year. The simple problem is that the CBO can’t score the tax plan against the 2018 Federal budget……….because there is no 2018 budget.
In fact, there has not been a legislated budget passed in the US since 2009, with the Federal government currently operating under another Continuing Resolution which will expire in December.
This means that before any tax reform plan can move to the Congress for a vote, a budget for 2018 must be passed.
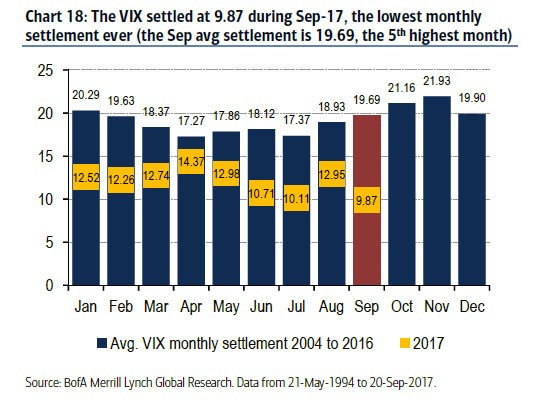
The chart below illustrates the monthly closing price of the VIX volatility Index in 2017, relative to the average prices dating back to 2004. It’s clear that the monthly volatility has been below trend in every month this year, with September closing almost 10 big figures lower than the average.
With equity valuations at extreme levels versus forward earnings per share, we expect some market event to trigger an increase in volatility back to the historic averages. However, at this point, we don’t expect that event to be the recently released tax reform proposal.


Monthly VIX Index


ALGO Sell Signal: Macquarie Group

During a thin, pre-holiday trading session on Friday, all the major banking names bounced off their intra-day lows.

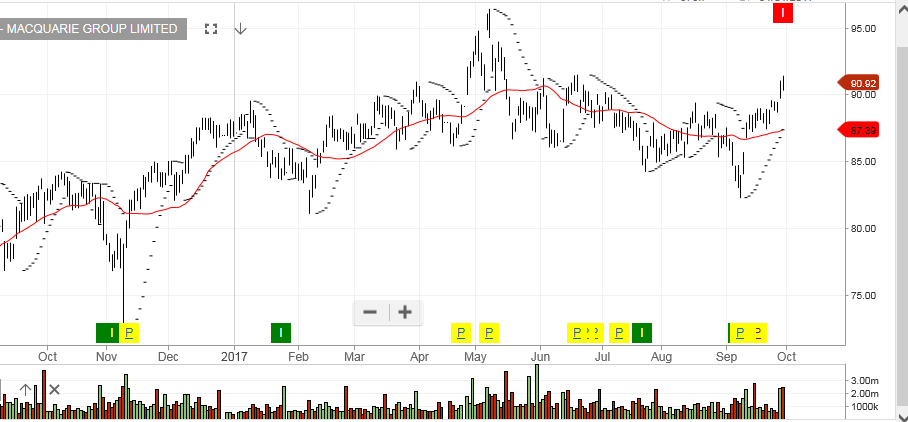
Into the close of ASX trade, our ALGO engine triggered a sell signal in MQG at $90.90.

MQG peaked on May 8th at $96.30; the day before the government announced the banking levy. Subsequently, the shares dipped to $82.30 on September 8th.

With all the local banking names facing headwinds in core revenue growth going forward, we consider the rebound in MQG shares as corrective in nature.

As the chart below illustrates, a trade back to the June 20th high of $91.45 would signal a “double top” and likely be met with selling interest.

With internal momentum indicators showing an “overbought” condition, we see scope for MQG shares to retest the $83.00 level over the medium-term.

Macquarie Group

Domino’s Pizza Isn’t Delivering

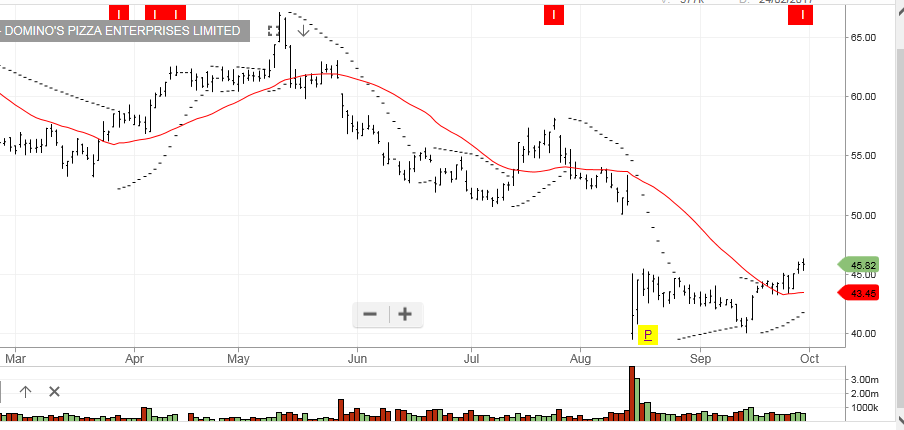
Our ALGO engine originally triggered a sell signal for Domino’s Pizza on July 25th at $58.00. Another sell signals was triggered on the close yesterday at $45.80.

As the chart below illustrates, the dominant chart pattern in the stock is the 13% gap lower between August 14th and 15th.

This gap lower coincided with Domino’s rollout of their new “Quality Fresh” promotion. Early numbers from the company haven’t shown that the “premium” pizza promotion has been a success.

Yesterday’s sell signal is just inside the gap area and fits into the “lower high” chart formation.

A reasonable downside target on DMP over the medium term is $38.00.

Domino’s Pizza


Gold Is Weak, Just Before Golden Week

After trading as high as $1358.00 on September 8th, the spot gold price has dropped close to 6% posting a low of $1277.00 during last night’s London session.

Several global-macro reports suggest that higher US interest rates combined with a stronger US Dollar were primary drivers of the yellow metal’s move lower.

However, daily charts show that in the lead up to Chinese Golden Week, the price of spot gold has dropped between 5% and 8% every year for the past four years.

In each of those years, the Spot price rebounded to make new highs over the course of October.

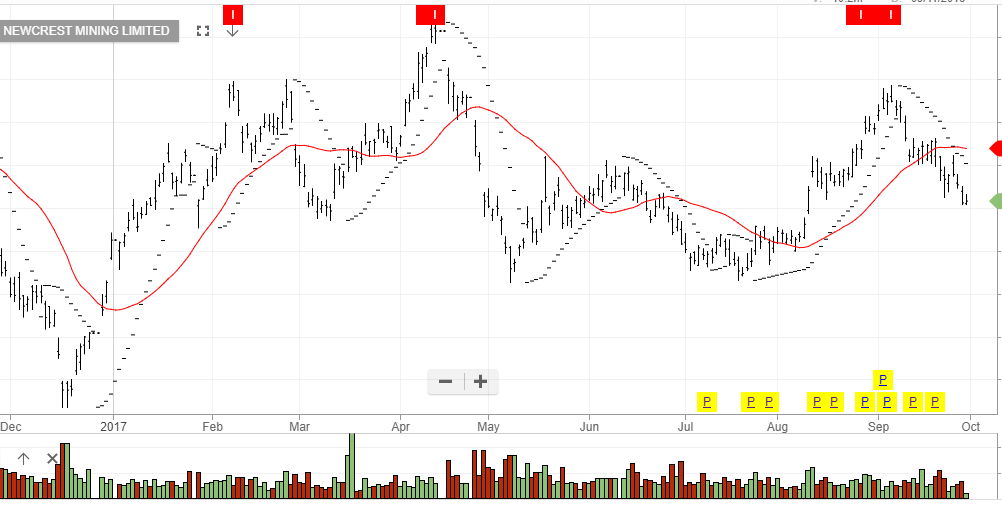
On September 20th, we posted that Newcrest Mining was a reasonable buy in the $21.80 range.

Looking forward, we expect the $21.00 area to offer good support for a move back into the $24.00 area into the end of the year.

Newcrest Mining


ALGO Update: Crown Is Back In The Buy-Zone

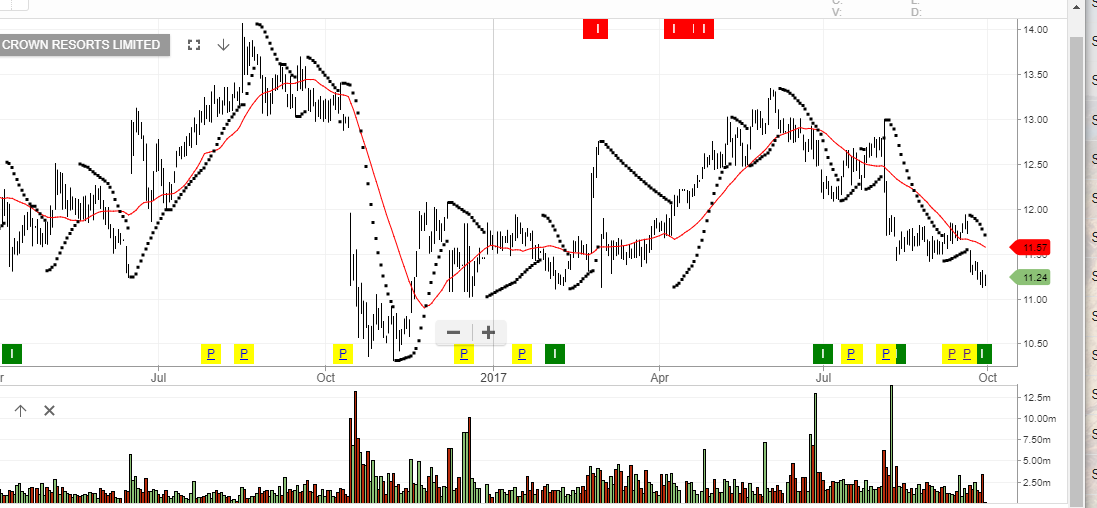
Shares of Crown LTD have drifted back into the lower part of the $11.00 handle, which we consider a buy zone.

Our ALGO engine triggered a buy signal on August 8th at $11.43, and again at $11.15 yesterday.

We acknowledge that the recent gaming numbers from the WA casino were down, and that the general tone in the ASX 200 is soft.

However, we still see reasonable growth potential in CWN going forward and have a medium-term target of $12.80.

Crown LTD


ALGO Signal: Sell CSR

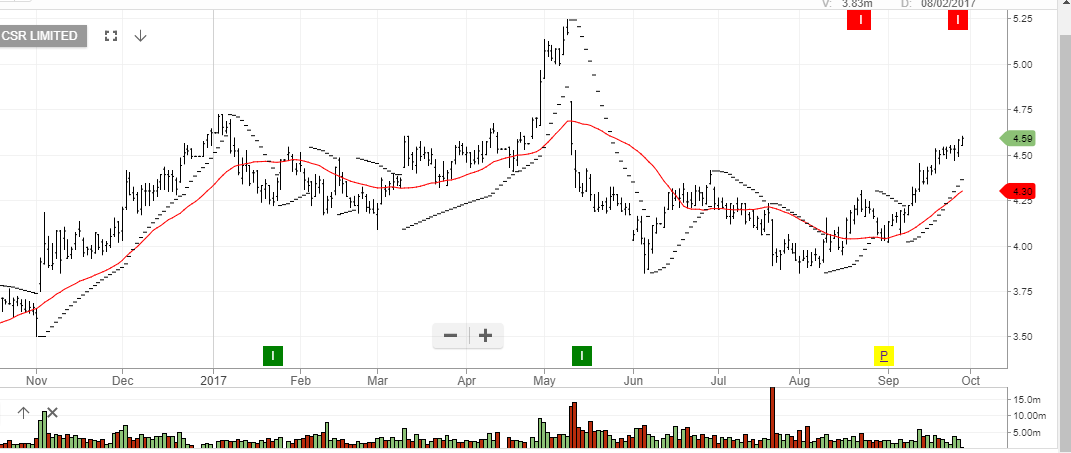
At the close of trade yesterday, our ALGO engine triggered a sell signal on CSR at $4.58.

This is the second sell signal in just over a month as shares of the building supply company are still trading within a “lower high” formation dating back the all-time high price reached at $5.25 on May 9th.

Fundamentally, much of the recent price rise could be attributed to the two hurricanes which passed through the USA, but that looks to have run its course.

Further,  earnings growth per share for CSR  is expected to fall up to 14% over the next three years.

With the recent EPS at 35 cents, this expected contraction could drag EPS down to 30 cents.

As such, our downside target over the medium-term is $3.70.

CSR