Spot Gold prices hit a 3-month high of USD 1,235.00 as geopolitical tensions increased the yellow metal’s safe haven appeal.
Political uncertainty regarding upcoming elections in Europe, the US and Iran exchanging threats and unstable banking sectors in Italy and Greece have all added to investors’ interest in Gold.
From a technical perspective, the next key price target is at the November 11th high of USD 1292.00. We would suggest exiting long positions in that area.
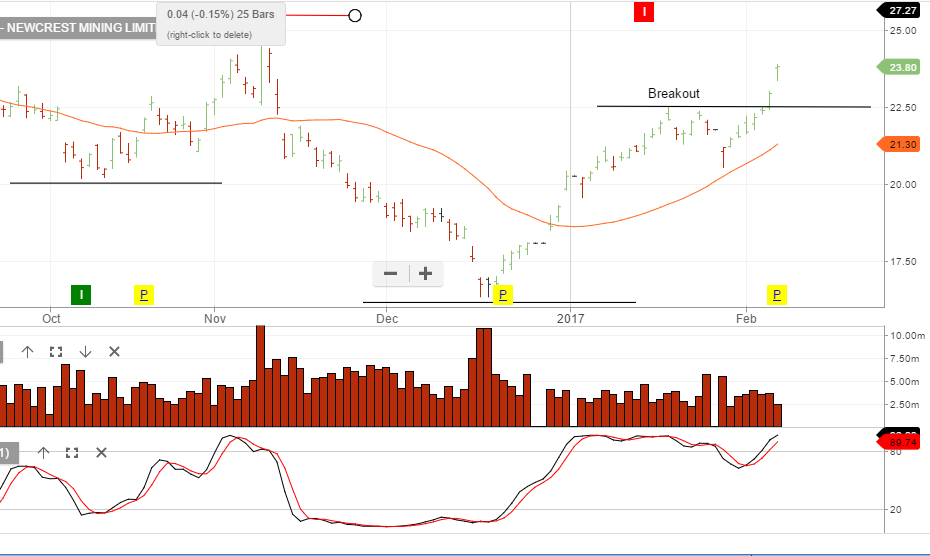
Shares of Newcrest Mining have followed the gold price higher and have rallied over $3.50 during the last eight trading sessions. We expect to see the $24.50 level offer the next area of resistance and look to exit long positions in that range.
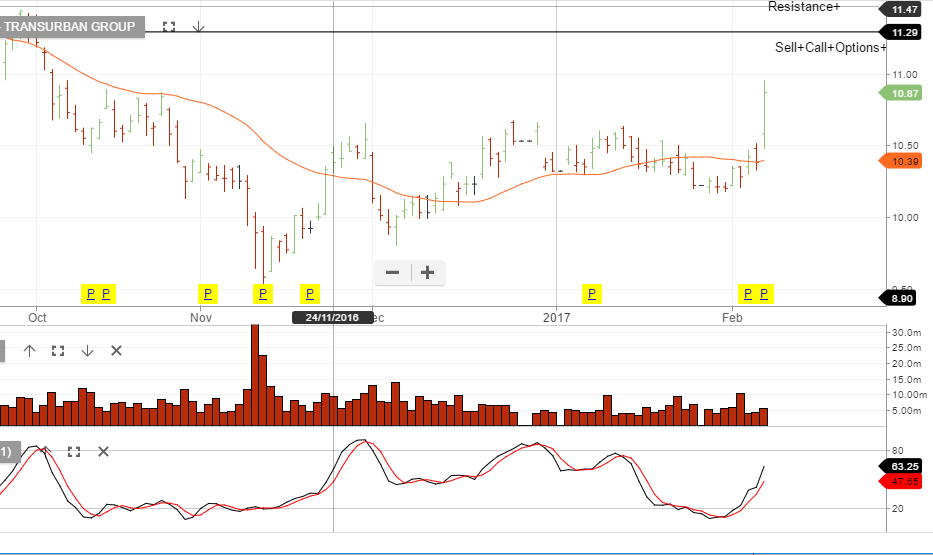
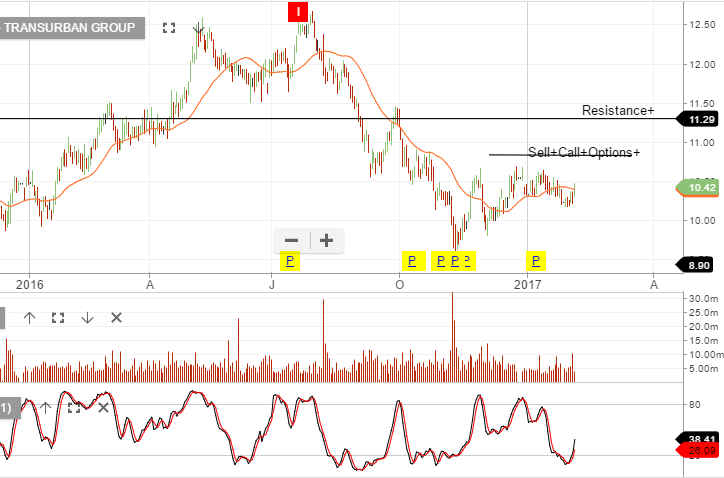
Shares of Transurban are up over 3.5% in early trade as the toll road developer increased H1 net profit 41.9% to $88 million on the back of strong traffic flows and operational performance.
The company also lifted revenue by 26.3% to $1.3 billion in the six months to December 31st.
As a result, Transurban will pay a partially franked interim dividend of 25 cents per share, up from 22.5 cents from the year ago period.
At $10.75 per share, we consider TCL a defensive income play. With limited scope on the upside, we suggest selling covered calls in the $11.25 area for an annual return in the 10 to 12 % range.
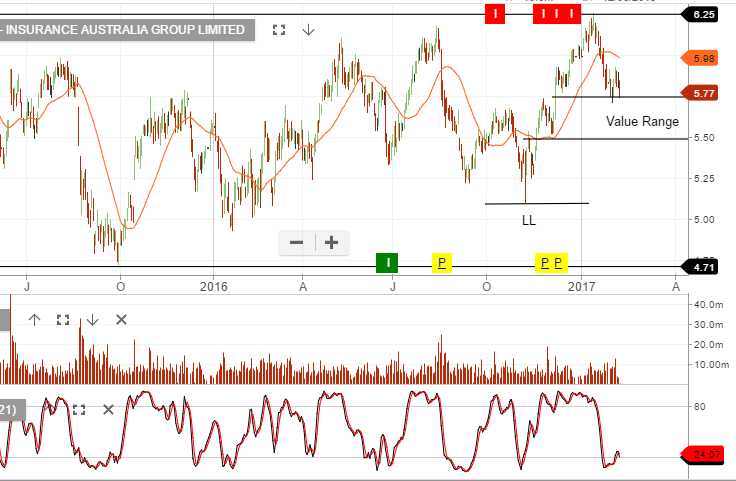
We highlighted in this month’s video report that IAG would likely find support at $5.50. The stock has since traded down and tested the $5.50 range and buyers have pushed the stock back to $5.80.
We see a place for IAG in portfolios based on FY17 earnings of $900m, EPS $0.36 and DPS of $0.32 which places the stock on a forward yield of 5.5%. We compliment this with a tight covered call option to increase the cash flow to 12% on an annualised basis.
$6.00 remains resistance and we don’t see the stock trading above this level in the short term.
Note: IAG has implemented an optimisation program that will reduce gross operating costs by an annual run rate of at least 10%, or $250m by the end of FY19.
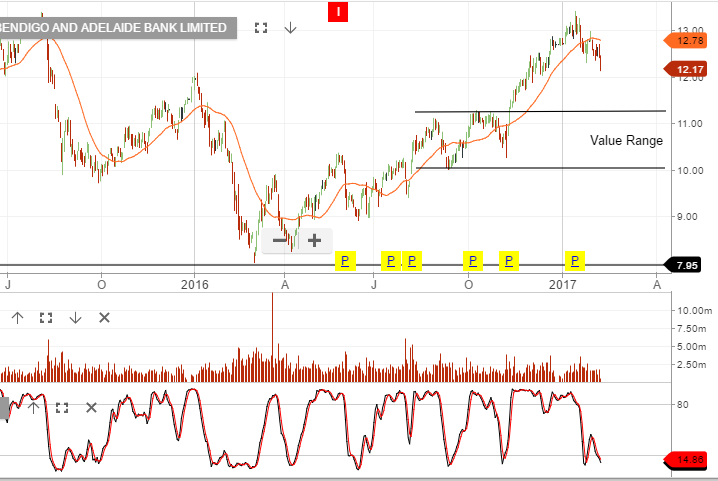
BEN will report 1H17 earnings on Monday the 13th. We’re expecting 1 – 4% growth on the same time last year. Full FY17 forecast profit should be around $450m.
In general, across the bank names we expect margins and credit quality to be the key areas of focus at the upcoming results. Benign credit growth conditions underpinned by slowing housing credit & flat growth in business lending.
Highly leveraged household balance sheets and ongoing pressure from the regulator to improve the quality of housing lending, should restrict the growth outlook into FY18.
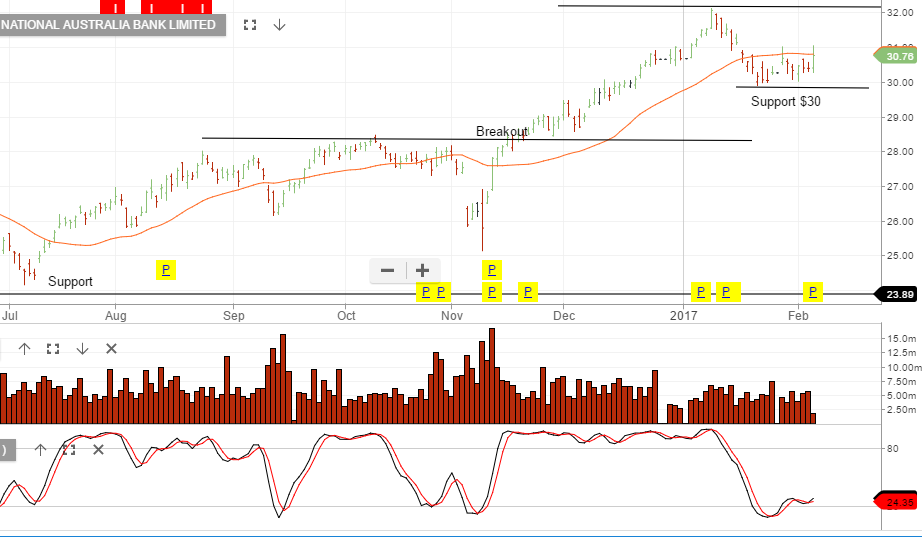
The National Australia bank (NAB) announced that Q1 profits have dropped 1% to $1.6 billion and rising staff wages and increased redundancy costs diluted the bank’s earnings.
In an update this morning, NAB reported revenue increased by 1%, but expenses, including a 5% pay rise for staff, grew faster. The bank said the rise in staffing costs was mainly due to a new enterprise agreement that came into effect in October and redundancy payments to staff who left the bank.
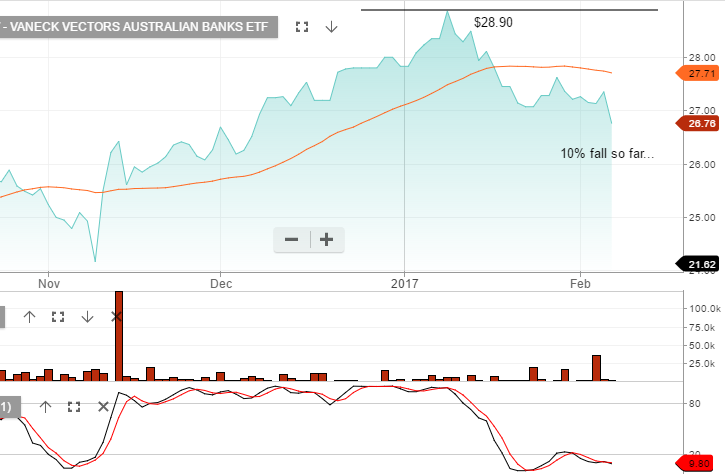
US banks rallied on Friday night which is helping to support our local bank names today. We give the bounce the benefit of the doubt but a break below recent support levels will likely see another 5 – 7% correction to the downside.
The People’s Bank of China (PBoC) surprised the market by tightening monetary policy on Friday for the first time in almost 6 years.
On the first day back from the Lunar New Year Holiday, the PBoC increased the cost of borrowing across their short-term curve from 1-month to 2-years. This move also raised the overnight deposit rate from 2.75% to 3.10%.
A rate hike on the first working day after a holiday signals the start of a different policy direction away from Central bank stimulus and towards more fiscal and domestic demand policy measures.
With Chinese factory orders rebounding after several years of deflation, Friday’s move reflects the PBoC’s determination to rein in leverage which has seen rapid expansion in the bond and property markets.
As a result of the higher rates, the Chinese Yuan traded to a 4-month high of of 6.79 against the US Dollar into the weekend.
We’re allocating funds to defensive names with moderate earnings growth. By adding tight covered call options we’re boosting the cash flow and generating our return on investment (ROI) through a lower risk, lower volatility investment process.
We’re holding small levels of hedging through inverse ETF’s and are mindful of the increasing number of stocks within the ASX 100 and the US S&P100 that are showing fading momentum. High valuations in many names combined with relatively low revenue and profit growth is likely to weigh on share price performance.
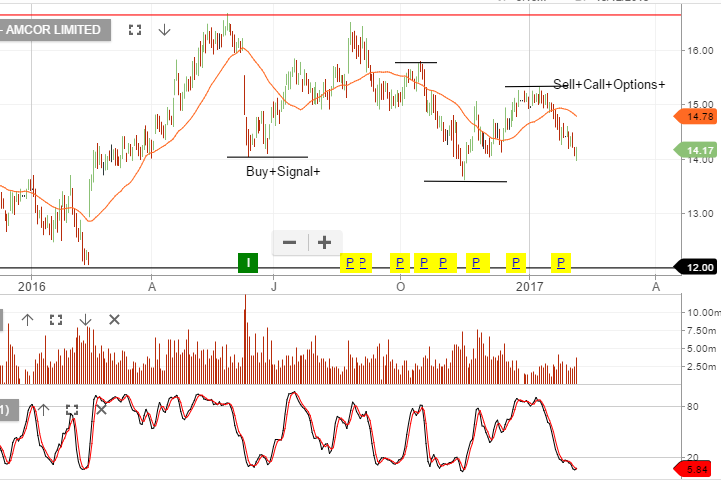
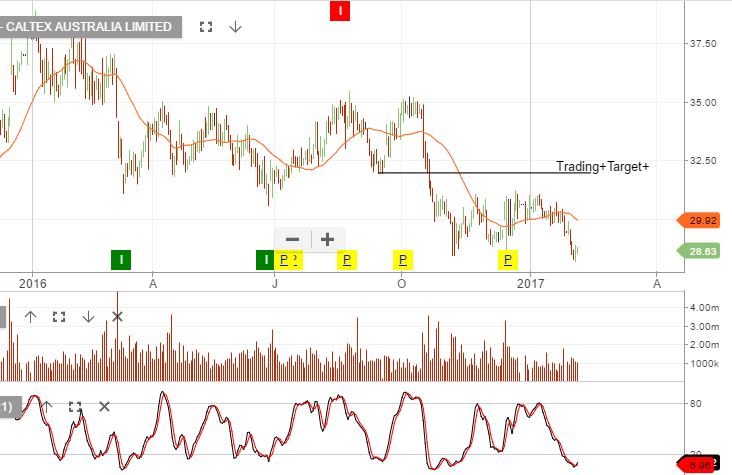
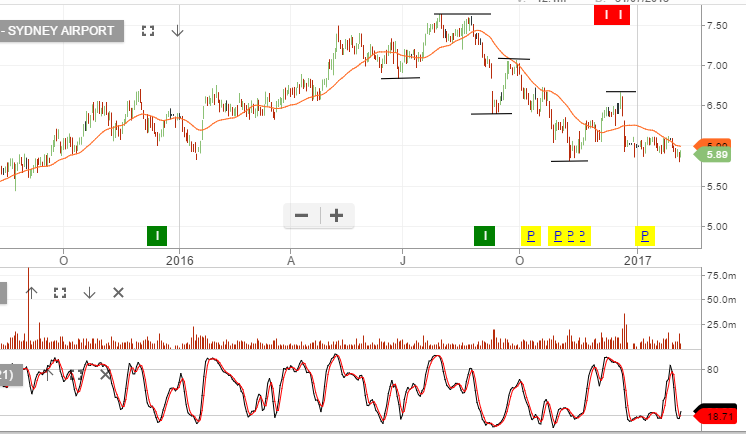
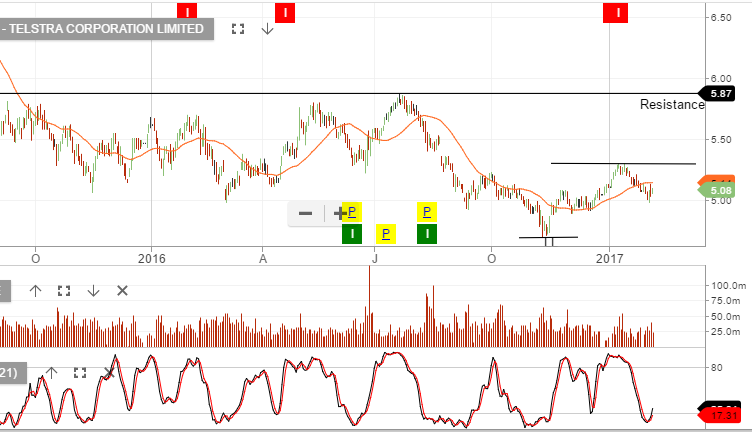
The following names we’re currently buying. AMC, CTX, SYD, TCL & TLS
US January Non-Farm Payrolls increased 227,000, which was well above consensus expectations of around 175,000.
The December revision was little changed at 157,000 from the 156,000 reported last month and the three-month average increased to 183,000 from 148,000 previously.
Unemployment rose to 4.8% from 4.7% the previous month and compared with expectations of an unchanged rate on the month.
Average earnings rose 0.1% for the month and this was well below consensus forecasts for a 0.3% gain. The December increase in average earnings was also revised down to 0.2% from the originally reported 0.4%.
The annual increase in earnings, therefore, slowed to 2.5% from 2.9% previously and was well below the 2.9% expected rate.
The stronger headline jobs number combined with weaker wages reduced the pressure on the FOMC to raise rates at their March meeting. This is reflected in the Fed Funds futures market where the implied probability of a rate hike fell from 18% prior to the payroll data to 9% by the New York close.
This market sentiment that rates could stay “lower for longer” lifted US Stock Indexes with the Dow and SP 500 gaining just under 1% for the day and the NASDAQ adding just over .50%
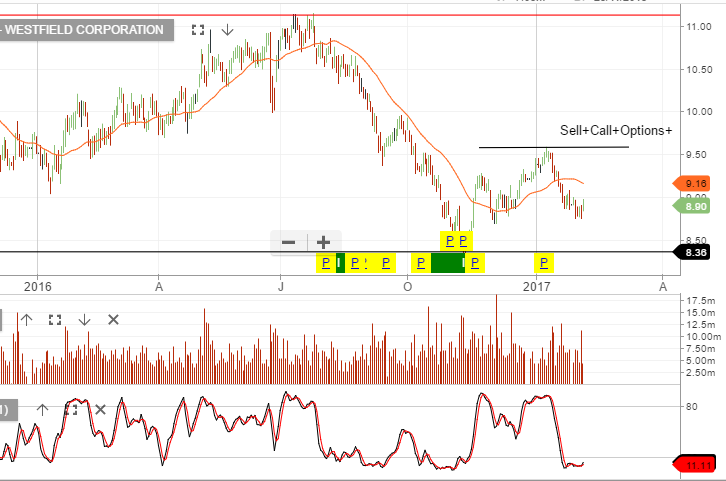
The lesson from the GFC when it comes to REITS is to own the best-in-class and ensure gearing levels are moderate. 20 to 35% gearing is okay, 45 -50% gearing is the range that caused problems 10 years ago.
We like WFD combined with a tight covered call option which is delivering 10 – 12% cash flow on an annualised basis.
Chart – Westfield
Sophisticated Investor?
We have special opportunities available for Sophisticated Investors. If you're interested, and qualify, please provide your details below.