Global Macro
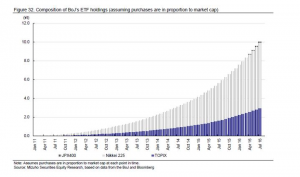
The BoJ also announced that they would maintain its JPY 6 trillion a year purchases of equity exchange traded funds (ETFs), but widened the distribution to include the broader TOPIX index and Nikkei 400 securities. Both of these indexes, along with the Nikkei 225 gained over 2% on the day and all closed above their 30-day moving averages.
The USD/JPY initially fell to 101.00 before rallying to just under 103.00 and then unwinding back below 101.00 in the lead up to the BoJ press conference. During the press conference, BoJ chief Haruhiko Kuroda stressed that the central bank has ample room to expand monetary stimulus such as deepening negative interest rates and accelerating asset purchases.
Mr Kuroda also said the central bank “would not rule out the possibility of considering new ideas or taking drastic measures if necessary to achieve its 2% inflation target”…….which seems to indicate that they are just making things up as they go along.
The FED’s decision to hold the Fed Funds target rate unchanged was complicated and not unanimous. While FED chief Janet Yellen said the case for normalizing rates has strengthened, the “consensus was not there.” Three regional FED presidents voted to lift rates, which was the largest dissent in three years. In the dot plots, three of 17 policymakers did not see a rate hike this year and it seems like Ms Yellen chose to keep the FED Board of Governors united by standing pat.
In the FED statement, the forward guidance indicated that rates would rise this year provided the labor market continued to improve and no new risks emerged. Some market commentators think this translates into an increased chance of a November rate hike. However, there is no historical precedent for a rate hike one week before a Federal election and the CME Fed Fund futures put the odds at just over 12%.
On balance, we expect the level of Central Bank fatigue to increase in coming months and financial markets to respond to more data driven and technical influences. In this respect, we would expect to see US Labor and consumption aggregates improve while similar data sets in the UK, Japan, Europe and Australia continue to trend lower. As such, our base case is that the USD Index will grind higher towards the 97.00 handle, US stock indexes will remain supported and US yields will have an upward bias.
BOJ ETF Holdings.
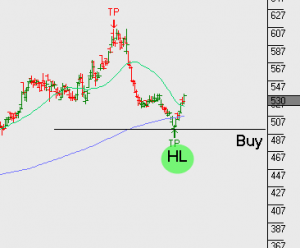
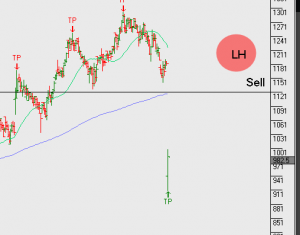
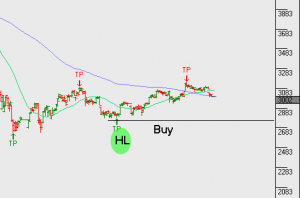
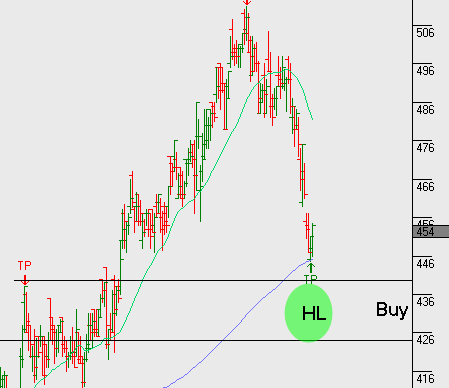
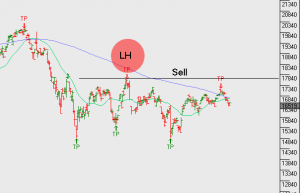 Hang Seng
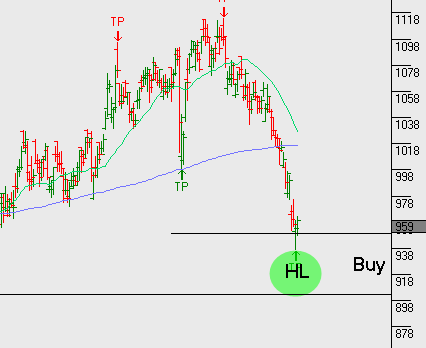
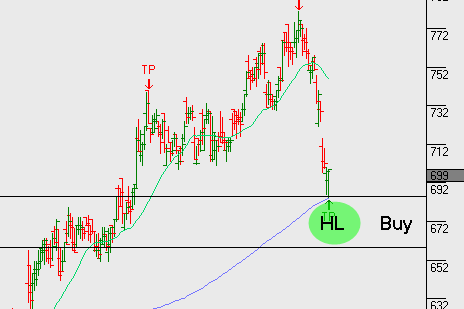
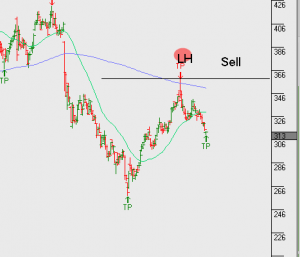
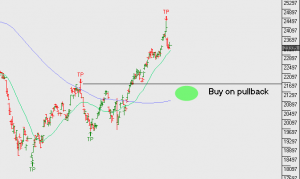 Shanghai Composite