Brambles – Running into Resistance

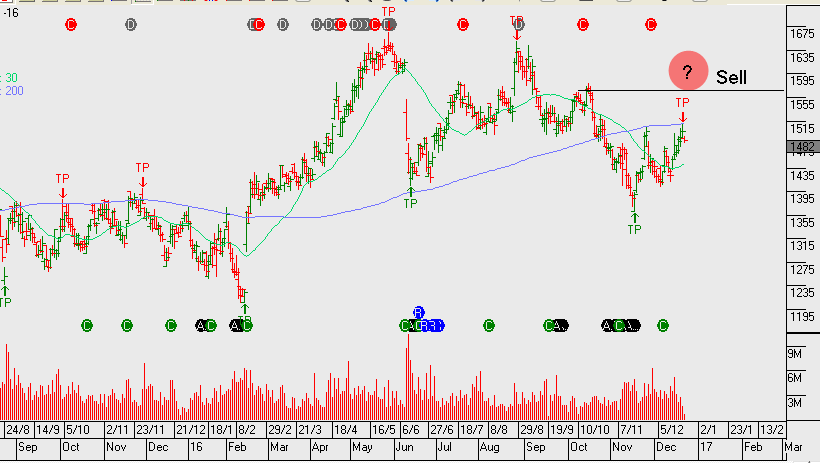
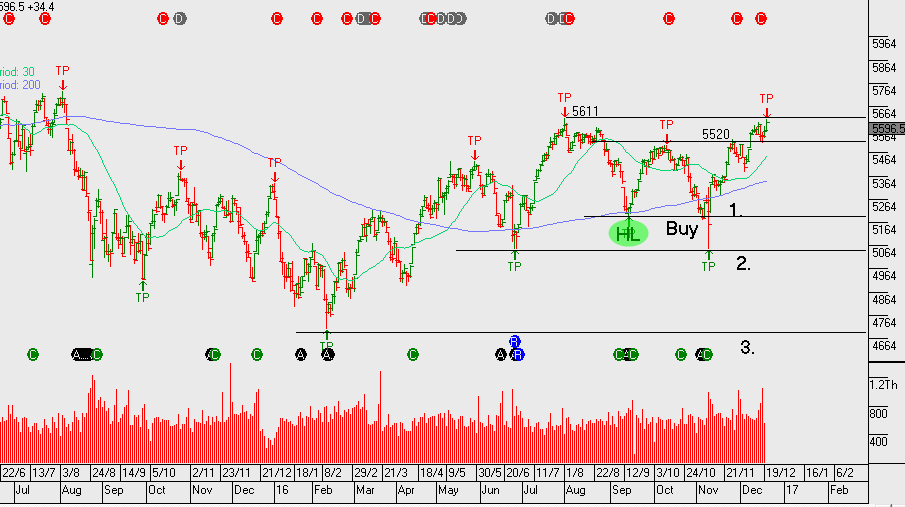
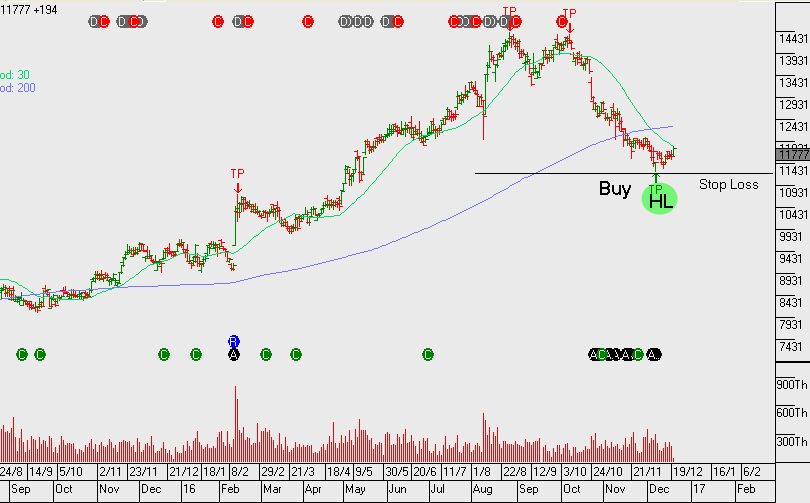
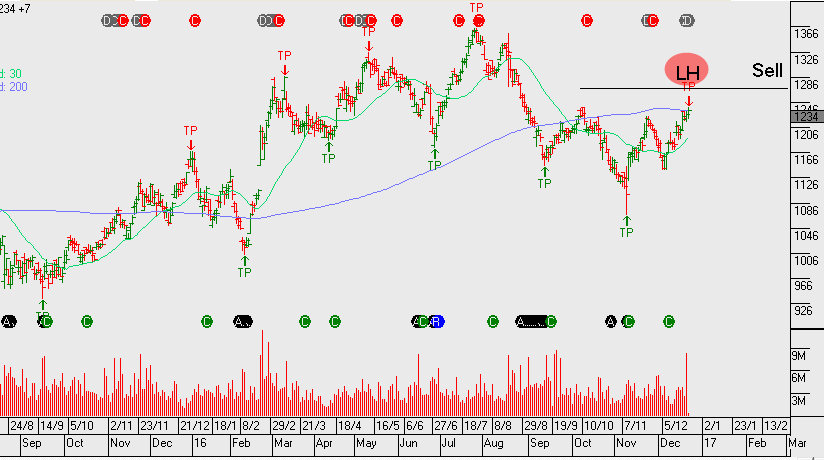
Shares of Brambles have bolted to new 3-month high at $12.35 as the trading conditions in the US and European markets continue to reflect a sustainable revenue outlook.

The international pallet, crate and container supplier is looking to benefit in FY 2017 from a recent joint venture in the in the Oil and Gas sector, as well as, a restructuring in their container division.

Despite a change in CEO, our EBIT remains unchanged in the 9.0% range, which is in the lower end of management’s 9-11% range.

In the near-term, we see price resistance in the $12.75 area and will look to sell covered calls in the $13.00 area to enhance the low 2.8% forward dividend yield on offer.

Chart - BXB
Chart – BXB

AMCOR – FX Headwinds

After meeting price resistance at $15.00 yesterday, shares of Amcor have opened over 1% lower $14.80.

Earlier in the year, the firm’s multi-currency revenue stream was considered a tailwind. However, with the USD trading sharply higher against the AUD and the EURO, these trends are now seen as a headwind to market earnings forecasts.

This means that our 1H 2017 forecasts are expected to show a marginal fall in profits from US$ 310 million to just above UD$ 300 million, or about 6% lower on a reported USD basis. For the full year in FY 2017, our constant FX forecasts are unchanged at US$ 700 million, which implies 5% YoY growth.

As such, we expect Amcor shares to trade in a sideways pattern over the medium-term and look to buy on a pull back based on the Algo signal alerts. At this point, with the share price in the upper band of the 6-month range, we will sell the covered call option to enhance yield and reduce volatility.

Chart - AMC
Chart – AMC


Woolworths – Bullish Price Action

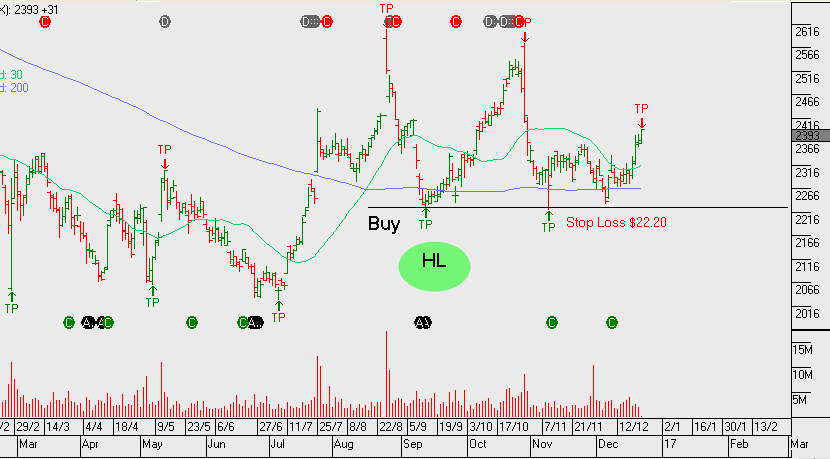
Woolworths has rallied from the November $22.20 support level. Based on consensus earnings the stock trades 18.5 times FY17 earnings and 3.8% dividend yield.

The earnings update in Jan/Feb will provide greater clarity on the turnaround following the Masters business failure and the refocus on Woolworth’s traditional food and liquor business.

Chart - WOW
Chart – WOW


FedEx Earnings

Shares of FedEx are down 3% at $192.80 in after market trade as the parcel delivery giant fell short of fiscal Q2 earnings estimates after the NY close today.

FedEx announced Q2 earnings of $2.80 per share on revenue $14.9 billion, while the market was expecting earnings of $2.90 with revenue climbing to $14.95 billion.

Total operating margin shrank to 7.8% from 9.1% a year ago, due to the FedEx “Ground” unit’s network expansion and increased purchase transportation rates, as well as higher IT expenses. Looking forward, adjusted FY 2017 earnings are still seen in the $12.00 to $12.25 range.

On balance, FedEx has offered good shareholder value this year climbing over 25% since January. We would expect to see buyers at, or around, the initial support area of $173.00

REA Group – Algo Signal Update

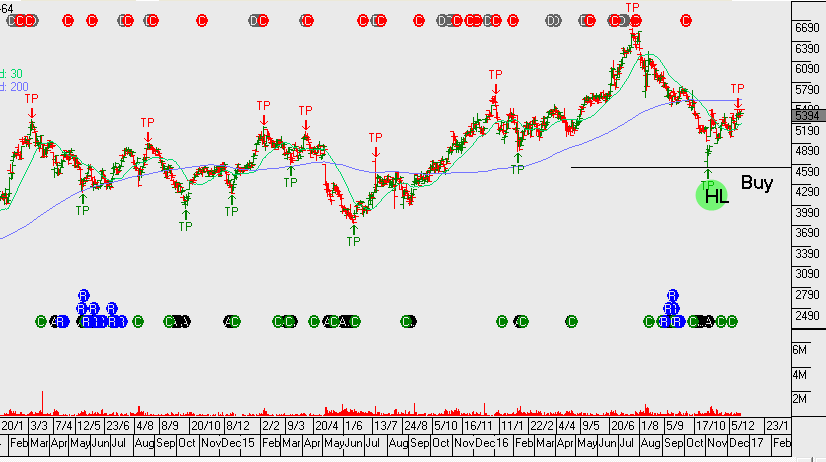
REA Group has announced the sale of its European assets to Oakley Capital Private Equity for $190m. Profit on the sale is expected to be around $170m. REA Group should see earnings pickup into 2017 & 2018 with FY18 revenue likely to grow by 10% to $850m and EBIT by 15%+ to $420m.

FY17 DPS $0.90 and FY18 DPS $1.10, places the stock on a forward yield of 2.1%.

REA payout 50% of earnings and the dividend is fully franked. The recent algo buy signal at $46 provided a solid entry point. We recommend applying a stop-loss on a break below the November low of $45.50

Chart - REA
Chart – REA


Commonwealth Bank – Visa Inc Sale

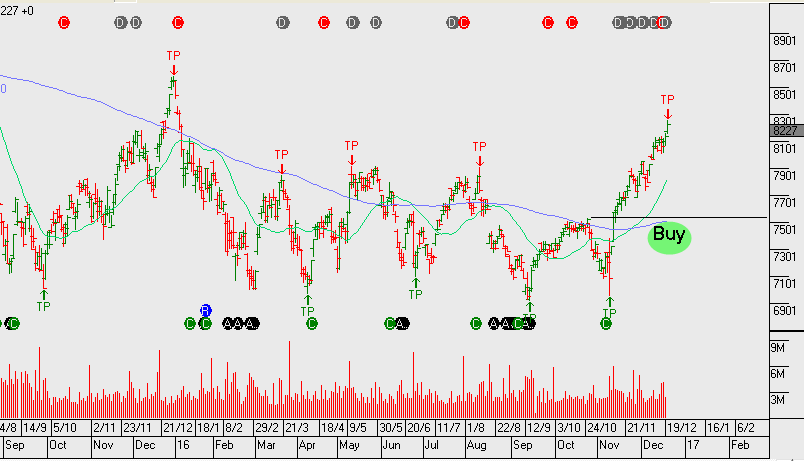
Shares of the Commonwealth Bank (CBA) posted a new high for the year at $82.65 as the bank announced it has sold its remaining stake in the US financial services company, Visa Inc.

The CBA sold its stake in Visa for A$439 million, realizing a post-tax profit of A$278 million. Against this profit, CBA has also announced a one-off accelerated amortization on certain capitalized software assets, totalling A$275 million.

While the accelerated amortization is more than offset by the profit on the sale of the bank’s Visa holdings, we see this move as reducing the potential for earnings uplift going into 2017. As such, heading into the February dividend, we see price resistance at or near the $83.00 level.


Chart - CBA
Chart – CBA


Global Macro: Strong Trends Into Year End

Political events and Central Bank policy moves have been driving global financial markets over the last two months. During this time, direct influence from weekly economic data seems to have diminished. With dealing desks starting to thin and investors looking to the holidays, this is likely to remain the case over the next two weeks.

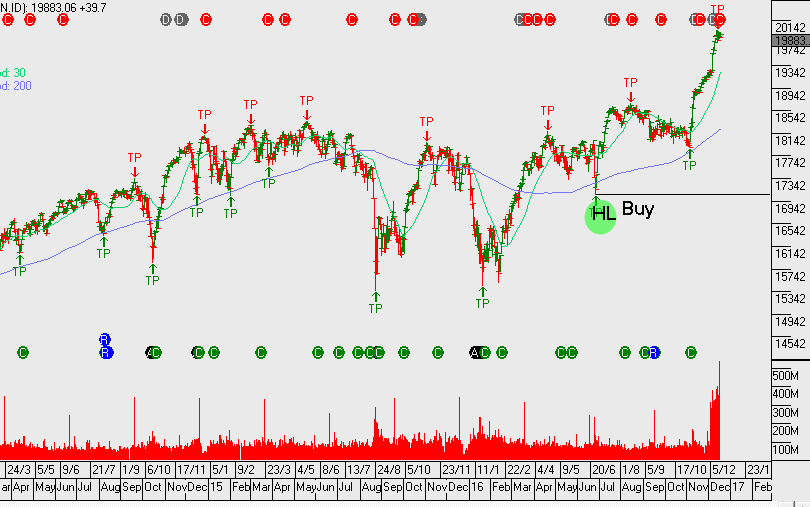
But even as financial markets slip into holiday mode, there are several powerful trends that are worth watching. Three of these trends have been particularly vigorous: The USD climb against the JPY, the rise in the US 10-year yields, and the rally in the SP 500 have all been very robust. In fact, these three markets have risen six weeks in a row and finished higher over nine of the last 11 weeks. Similarly, the USD Index and US 2-year yields have risen, while Gold has fallen, in seven of the last 11 week.

The key issue now is whether these trends will be extended, or if a profit taking phase will be seen into the end of the year. Arguments that these trends have gone too far too fast are now several weeks old. And even though technical readings are even more overstretched, there aren’t reliable fundamental arguments for taking aggressive positions in the opposite direction……….not yet, anyway.

The basic psychology of these recent trends suggests the new US administration will act swiftly to enact a comprehensive (fiscal) stimulus package; which will allow US stock valuations to expand and the US Dollar to appreciate vis-a-vis higher domestic interest rates.

On balance, we expect the current trends of higher US stocks, firm US Dollar and a steepening yield curve to continue, even as market flows edge into holiday mode.
Dow Jones

Gold: A Corrective Bounce

Gold has found initial support at the $1120.00 level and has posted a corrective move higher over the last two days.

The yellow metal is now approaching the technical downtrend line near $1155.00, which we feel will offer stiff resistance. The 30-day moving average is currently at $1186.00. The RSI has been in oversold territory below the 30.00 mark for over a month, so some price consolidation is expected before extending lower.

Newcrest Mining is currently 3.5% higher at 17.40. We view this move as corrective and would expect sellers to return at , or around, the 18.60 level.

Chart - NCM
Chart – NCM