Global Macro

The US Dollar Index has rallied to its strongest level in more than 13 years as the market continues to digest the ramifications of the FED’s more aggressive interest rate policy trajectory.

Financial markets weren’t surprised when the FOMC announced an increase to the Fed Funds target from .50% to .75%. The move had been widely expected since the October meeting and the FED funds futures had been pricing in a 100% percent certainty of the move.

However, financial markets were not expecting the FED’s “dot plots” to reflect expectations of at least three more rate moves during 2017. Since Wednesday’s announcement, we have seen the EUR/USD trade back below the 1.0400 level and the USD/JPY break the 118.50 level for the first time since February.

It’s important to remember that with a stronger USD comes headaches for other Central banks around the world who will incur a higher cost of servicing USD denominated debt. The stronger USD also poses a risk for the US economy especially in an environment of rising US finance costs.

In short, if the new administration doesn’t come up with a viable stimulus package quickly, the US economic growth story could fade. This could translate into a significant correction in US Stocks, US Treasury rates and the Greenback.

However,  before hitting the sell button on long US asset trades, it is important to realize that for the dollar rally to end, dollar bulls need a reason other than year end profit taking to give up on their trades. The latest round of economic reports continues to support the bullish move in the US Dollar.

Despite a stronger USD, manufacturing activity in the NY and Philadelphia regions accelerated. Consumer prices also grew 0.2%, which was in line with expectations and jobless claims dropped to 254K from 255K. The NAHB housing market index jumped to its highest level in 11 years.

The stronger USD over the last month should have softened these data: weakened the trade figures, manufacturing activity and made it more difficult for the Fed to achieve its inflation target, but we need to see evidence of that before selling the USD and US Stocks.

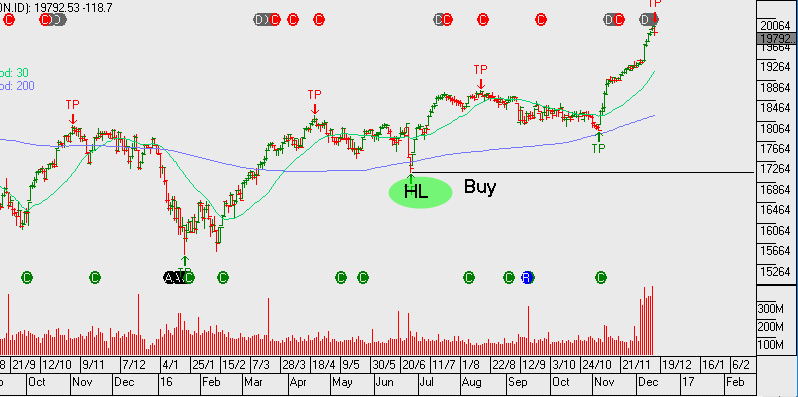
In the meantime, US assets remain in a strong uptrend targeting 20,000 in the DJ 30 and a move in the direction of parity for the EUR/USD.
Incitec Pivot Ltd

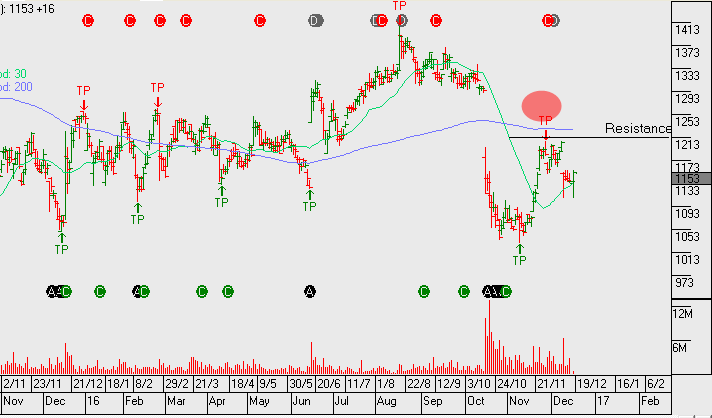
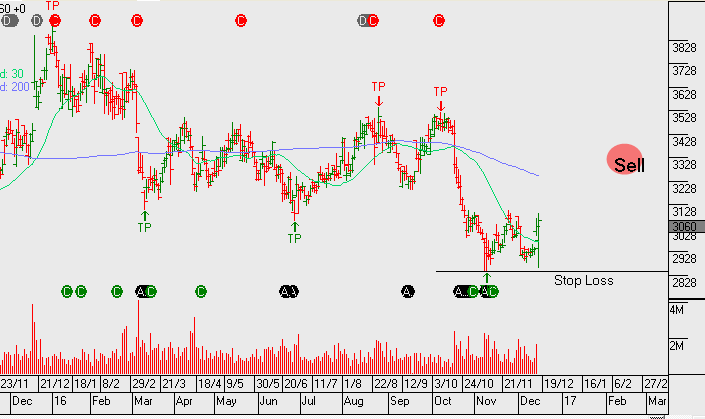
Shares of Incitec Pivot posted a 10 month high of $3.55 last Friday, and could test chart resistance near the $4.00 mark in the near-term.

The highlight for the chemical firm has been the early success at their their new ammonia plant in Louisiana.

The new facility, which came in below the US$ 850 million budget, has scaled-up to over 80% capacity utilization with nearly 72kt short tons produced between October and November.

We like IPL, as a firm, and the growth potential of the chemical sector into 2017. As such, we will put IPL on our ALGO radar and look to buy on a dip back into the $3.10 support area.

Crown Resorts – Update

Crown Resorts has announced several changes to their strategic business plan to simplify the business and enhance their balance sheet.

The firm has decided to cancel its Alon project in Las Vegas, sell off a major stake in its Macau casino business and cancel plans to spin off its international business.

The company will sell off almost half of its holdings in Melco Crown Entertainment for $1.6 billion, using the proceeds to cut debt, pay a special dividend of $500 million and enable a share buyback of around $300 million. Crown’s share of Melco’s annual net profit dropped by 60% in 2016 to $43 million following a corruption crackdown by Chinese authorities.

We still like the long side of CWN, although our upside target has been lowered from $14.00 to $12.50 following earnings revisions due to CWN’s reduced stake in Melco. CWN currently trades on 10x FY 17 estimated EBITDA and is on pace for a 5% yield for FY 2017.  

Chart - CWN
Chart – CWN

Caltex Trade Recommendation

Caltex delivered upbeat profit guidance following strong performances in Lytton and Marketing & Supply divisions. Fy17 revenue $16b, EBIT $900m on EPS of $2.30 and DPS of $1.20. This represent year on year underlying growth of around 10%.

The chart below shows the market’s favourable reaction to the updated guidance with CTX rallying $1.40 from yesterday’s session lows. CTX trades on Fy17 PE of 13x and 4% dividend yield.

Here is our strategy recommendation on Caltex…

Buy CTX at market, sell May $32.50 call for $1.00 credit. March dividend will be $0.50+

Total return if exercised 13%+ in 5.5 months.

Chart - CTX
Chart – CTX

FED’s 25 basis point increase

The US Stock market slipped lower on the back of the Federal Open Market Committee’s (FOMC) policy announcement today. The market wasn’t surprised by the FED’s 25 basis point increase in the Overnight Fed Funds target, but the “Dot Plot” forward guidance shows policymakers are looking for 3 rate hikes of 25 basis points in 2017.

This view is more aggressive than the 50 basis point move the FOMC discussed back in September, which pushed equities lower and lifted the yield on the US 10-year treasury notes to a three year high of 2.57%. It’s worth noting that the 10-year yield traded at 1.35% in July; which means the yield on the US benchmark treasury note has essentially doubled in less than 5 months.

In her post-announcement press conference, FED chief, Janet Yellen, described the move as a “very modest adjustment”, which suggests this year’s forward guidance may mean another move on rates as early as May 2017.

We don’t see this a trend-changer in the major US stock indexes. However, we do see scope for a near-term correction back to the 19,450 level in the DOW Jones 30 and a move back to 2190 in the SP 500.  

Chart - Dow Jones
Chart – Dow Jones

Dow Jones 30 Review

This is a 5 minute video looking at the buy and sell signals within the Dow Jones top 30 stocks.

Investor Signals now offers US stocks and we can work in partnership with you to build and manage a portfolio that captures both long and short trading signals.

email me leon@investorsignals.com if you’d like to discuss what we can do to help with your US portfolio exposure.

Wesfarmers – Limited Growth

Over the last four years, Wesfarmers’ share price has traded in an $8.00 range between $38.00 and $46.00. Although the diversified company has consistently paid out fully franked dividends and has been yielding around 5% over the past few years, the lack of share price appreciation has been a concern for longer-term shareholders.

While the Bunnings division of the company has been gaining market share with the demise of Masters, it seems the market rates Wesfarmers earnings lower reflecting a view that the Coles division faces increased competition from the discount chain, Aldi.

Wesfamers has also entered the UK hardware sector with the acquisition of Homebase January of this year, which has yet to show a similar level of success as the Bunnings division.

We don’t expect the limited upside of the share price to improve anytime soon and will continue to employ the covered call strategy on rallies up to the $43.00 area; collecting the franking credits, a dividend of over $2.00 per share and the option premium. Our strategy is helping to boost cash flow to 13%+ per annum

Chart - WES
Chart – WES


Gold Hits 10-Month Low

Gold traded at fresh 10-month low at 1151.00 as a stronger US Dollar and the prospects of higher US interest rates continues to pressure the yellow metal.

Since trading as high as $1335.00 on November 9th, Gold has lost close to $200.00 per ounce. And while technical indicators are showing oversold conditions on the daily charts, we still see scope to test the $1100.00 support level last seen in January.

NCM - New Crest Mining
NCM – New Crest Mining