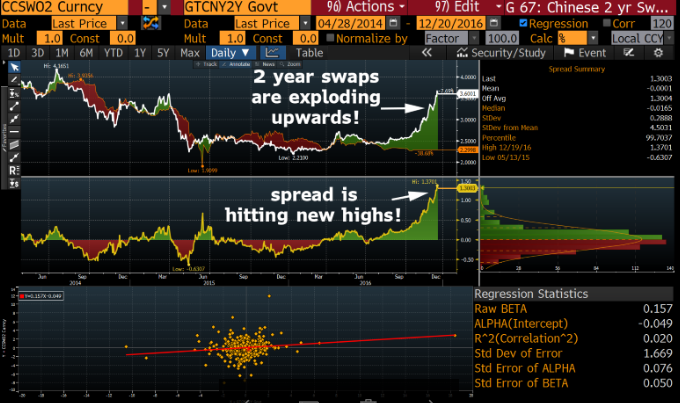
Over the past two months, the Chinese Interbank Funding market has come under structural pressure as the Government has introduced changes to domestic capital control regulations. The goal of these changes is to stem the flow of Yuan leaving the country.
An unintended consequence of these new capital measures has been acute liquidity shortages in the secondary bond markets, which have triggered two trading halts over the last month. The chart shows how the 2-year swap rates have surged higher as uncertainty about future funding lines has seen overnight lending rates gyrate between 3.5% to 17.00% over the last 60 days.
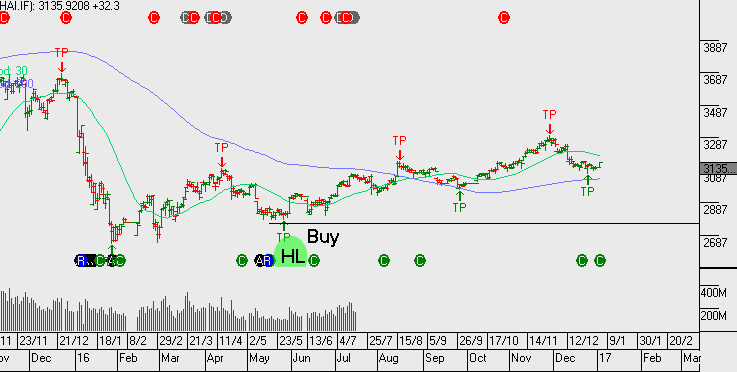
The primary concern for Australian investors is how this bond market instability could impact Australian exports of raw materials, consumer goods and agricultural products to the mainland. As a knock-on effect, the Shanghai Index has lost over 4% over the last month and the Chinese Yuan pricing has increased in volatility…….neither of which were intended goals of the new capital measures.
We will continue to monitor developments in the Chinese market and pass along any trade suggestions which the may be triggered from the Algo engine.
Looking across the financial horizon, it appears by many measures that 2016 is ending with similar dynamic as 2015: G-7 stock indexes are at or near their highs, the USD Index is on an upswing, the US Federal Reserve lifted rates causing bond yield to firm and Gold prices are stabilizing after a sharp November drop.
As such, the financial media is content to wrap up the year by only focusing on the price action from the last two months and ignoring the two-way market volatility experienced in the previous 10 months.
Looking into 2017, it’s worth noting that as optimistic as the end of 2015 outlook was, the SP 500 started 2016 under pressure and dropped over 250 points, or 12% by January 20th.
We have identified three potential flashpoints which may trigger a significant correction from the recent post-US election rally during the month of January.
First, the Italian banking sector continues to sag as political manoeuvring has greatly outpaced the progress of any meaningful economic solution. At this point, the focus has been on the bailout of Monte Paschi Bank. Recent “stress tests” have shown that the solvency gap needed to rescue Italy’s oldest lender has grown from €5.5 billion to over €10 billion.
The immediate contagion risk has spread to 10 other EU banks who are holding substantial Monte Paschi debt obligations.
The second potential flash point stems from recent liquidity shocks in the Chinese bond market. Credit conditions have tighten sharply over the last two weeks as over 25 corporate bond issue face a potential default.
This pressure has seen 2-year swap rates spike higher, which has forced the Peoples Bank of China (PBoC) to inject over $60 billion into the short-term money market just to keep the secondary Treasury market from triggering a trading halt…….like it did on December 15th.
Many investors overlook the impact that even temporary credit shocks can have on global equity markets. However, according to some estimates, the global bond market has more than tripled in size over the last 15 years and now exceeds over $ 100 trillion.
By contrast, Dow Jones Research puts the value of the global stock market at just under $65 trillion. In the US alone, bond markets make up over $40 trillion in value, compared to less than $20 trillion for the domestic stock market. In this sense, as G-7 Central bank policies have removed traditional market anchors, a liquidity or solvency shock in a domestic bond market can have a profound impact on global equity markets.
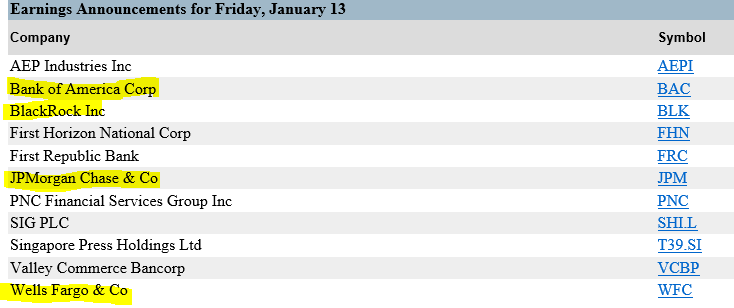
The third potential flash point involves the US earnings season. US companies will begin reporting in the fist week of January with JP Morgan , BoA and Wells Fargo leading the banks starting on January 13th. Forward estimates suggest that the post-election rally has lifted many of the banking names into price valuations which the earnings reports may not be able to support.
It’s not our base case that an external market shock will trigger a protracted sell off in global equity prices and derail the bull market structure during 2017. However, we feel that it’s important for investors to be aware of the potential of such risks and have a strategy in place to protect portfolio holdings during a market correction.
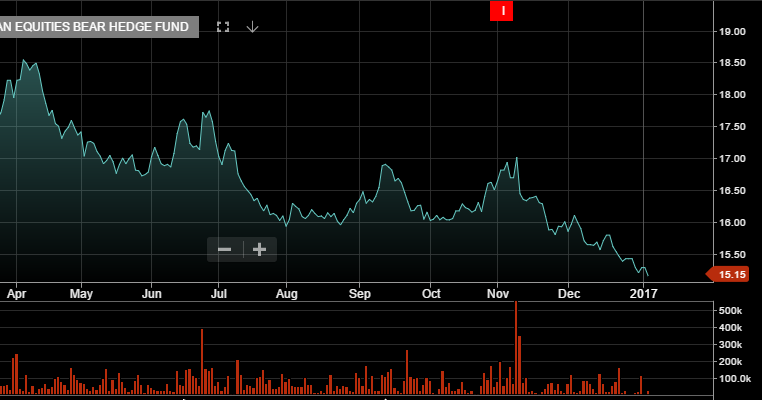
A product which fits this description is the BetsShares BEAR Exchange traded fund (ETF). The BEAR EFT Gives investors a simple and accessible way to obtain ‘short’ exposure to the market.
If you would like to learn more about how the Beta-Share BEAR ETF can protect the long-side of your portfolio, or if you just want to learn how to profit from a downside correction in the ASX 200, get in contact with us and we’ll be happy to introduce you to this dynamic product.
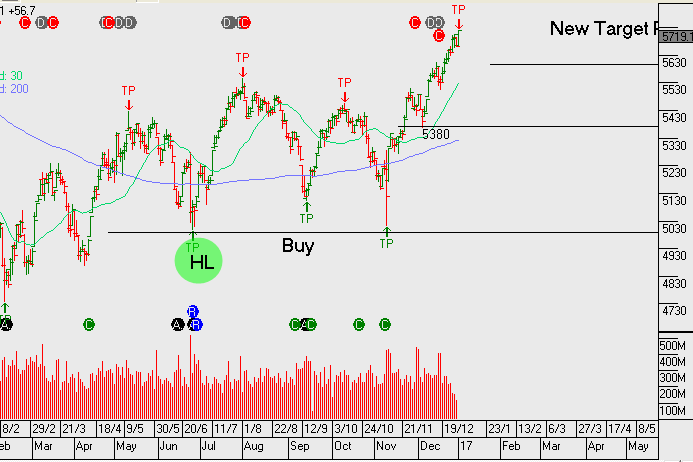
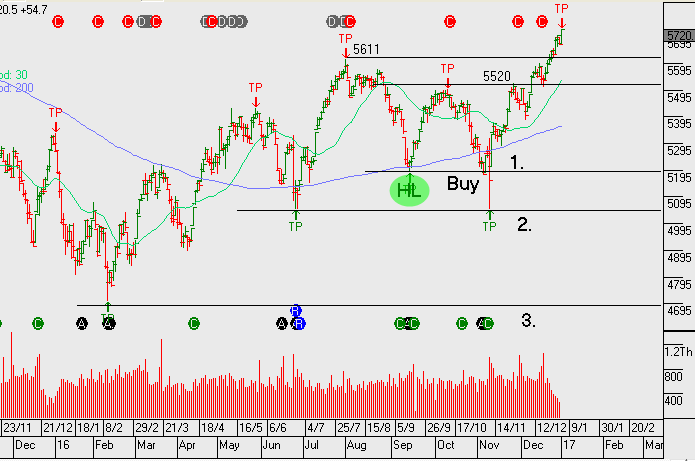
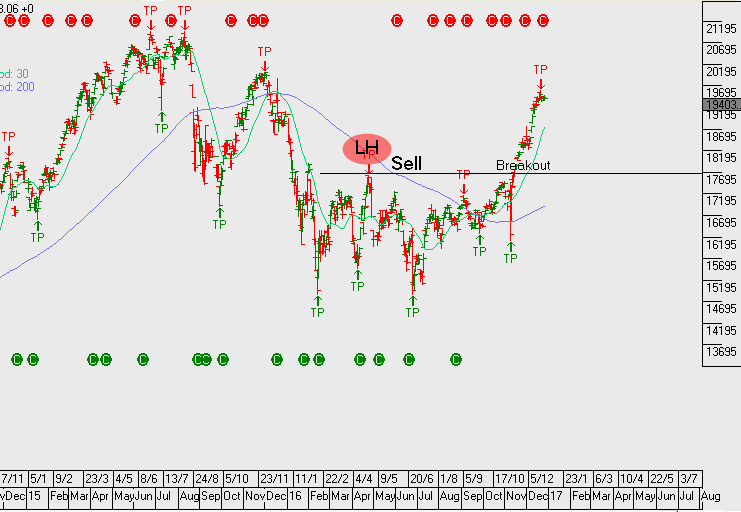
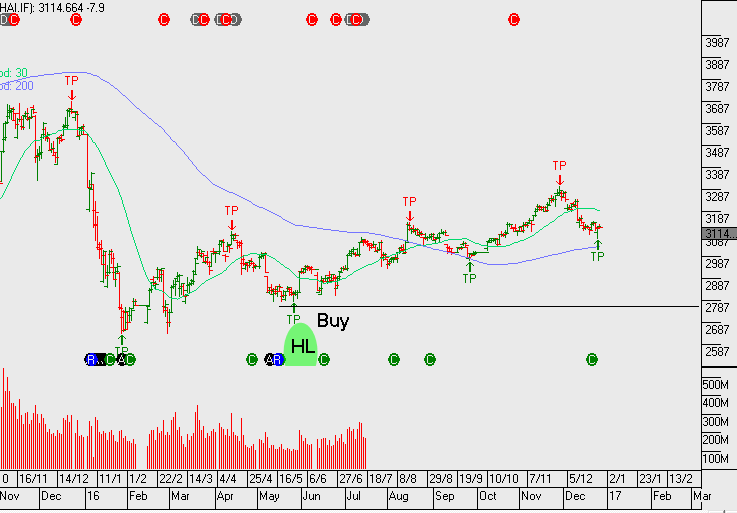
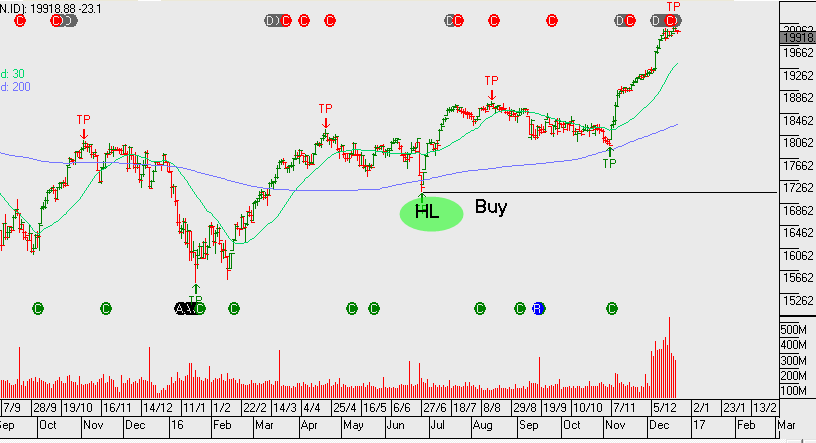
The XJO (ASX200) and the XLF (ASX top 50) continue to trend higher following the breakout which began in early December. We’re now up around 5% from the December low and we’re up over 20% from the 2016 low formed in January.
The XJO is trading 17.5x forward earnings on a 4% yield. Our focus will soon shift towards the upcoming US earnings which begin later this week.
Chart – XFL (ASX top 50)Chart – XJO (ASX top 200)Table – US Earnings
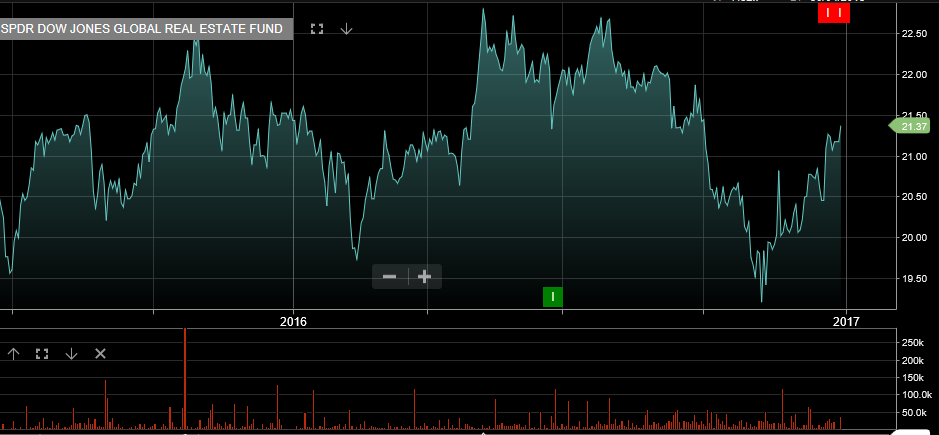
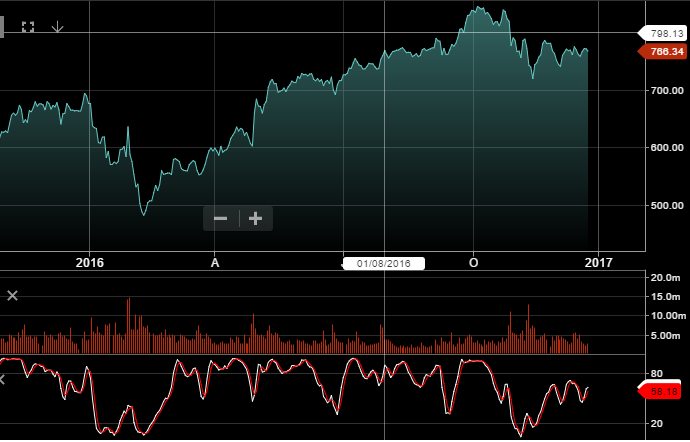
The Algo Engine has triggered a short signal in the ASX listed SPDR Dow Jones Global Real Estate Fund. We’re being alerted to the change in structural trend and the potential that we’re in a counter trend bounce. To align this technical picture with fundamental analysis it’s most likely that a trigger for a sell-off in yield sensitive names, (such as property trusts), needs further upside in US bond yields to generate the tipping point.
We struggle with the timing of the above alert, as our base case for markets is that US yields are topping out short term and not moving higher. Therefore, not providing the catalyst needed to go short yield sensitive names.
Domestically, many of our REIT’S also display a very similar technical picture to the below chart. Our preference from an asset allocation perspective is to use the current short signals in yield sensitive names as a timing tool to sell at-the-money calls.
Going into 2017, one of the biggest decisions investors face is what portfolio weighting to allocate to Australian banks.
Over the past three years, the Australian banking sector has grown to represent over 30% of the ASX 100 capitalization.
This growth has been supported by record bank profits, weakness in other sectors and the chase for yield by offshore investors as central banks in Europe, Japan and the USA have pushed interest rates to historically low levels.
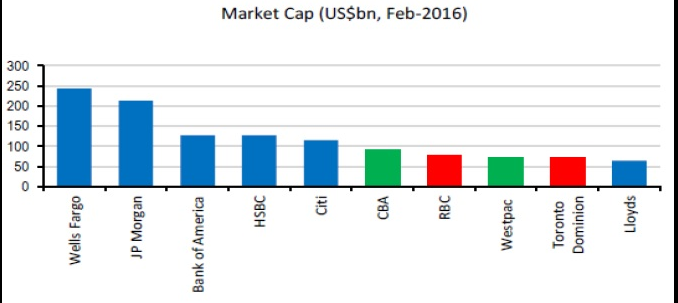
This has contributed to all four of Australia’s primary banks now being in the top 15 global banks by market capitalization, despite their relatively small footprint in the global financial system. In fact, as of February 2016, both CBA and Westpac were listed in the top 10 global banks in terms of market capitalization.
Over the past five years, Australian banks have been very successful in generating profits from their domestic branches which operate in a snug banking oligopoly. Competition from non-bank lenders hasn’t increased materially in the mortgage area and bad debts remain at manageable levels.
Nevertheless, Australian banking shares (while offering high dividend yields) are likely to face a fairly constrained pricing environment and higher loan losses, should the domestic economy continue to slow in 2017.
It’s been reported that international fund managers have been systematically, shorting Australian banks based on the belief that the domestic housing market is overvalued and primed for the same dramatic decline which occurred in Ireland, Spain and the USA over the last 10 years.
Furthermore, a growing number of analysts are suggesting that protracted weakness in the local economy will burst the housing bubble, contributing to the Government losing its AAA credit rating and putting downward pressure on Australian bank share prices throughout 2017.
Our base case is not quite that grim. However, we do expect to see limited upside to the share prices of the big four banks from current levels and eventual rotation into healthcare companies and yield names.
From a technical perspective, we expect to see price resistance for the four major banks around the following levels: WBC $33.50, CBA $86.00, ANZ $32.50, NAB $32.00.
Flash points for the global equity markets in 2017 remain Italian Banks, Chinese Economy & uncertainty around Trump presidency.
Japan continues to struggle to shake off deflationary pressures as the November consumer price index fell for the ninth straight month. Bank of Japan Governor,Haruhiko Kuroda rejected claims the BOJ’s yield curve control and 2% inflation target may be too ambitious and that the central bank has room for more economic stimulus.
China’s 6.5% economic growth target may not be maintained, especially if it continues to compound the rising debt issues the country faces and creates too much risk.
During 2016 we’ve been bullish on the Chinese equity markets which performed inline with our forecasts. The strength and the breakout in the Japanese equities on the other hand, caught us a little by surprise.
The breakout in the Nikkei has been fuelled by the BOJ’s broad-based equity ETF being program and the recent weakness in the Yen.
From the team at Investor Signals, we wish you and your family a Merry Christmas and Happy Holiday. May the spirit of the season bring you happiness, joy & good times with your loved ones.
Thank you for your involvement & support throughout 2016 and I look forward to working with you to help successfully navigate the markets in 2017. Merry Christmas and wishing you a happy & prosperous 2017.
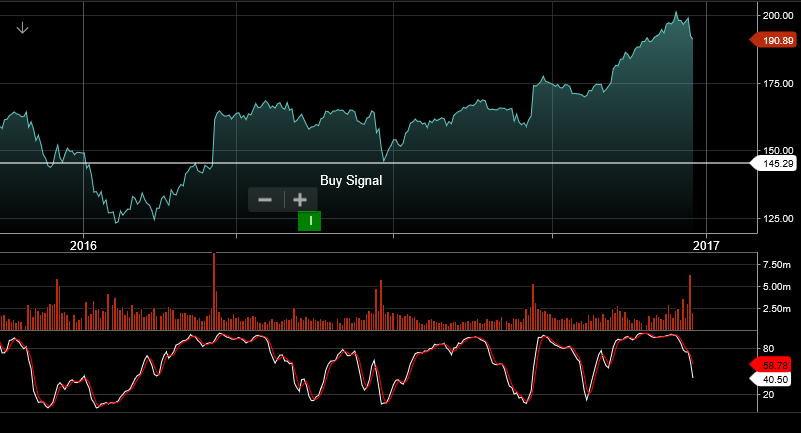
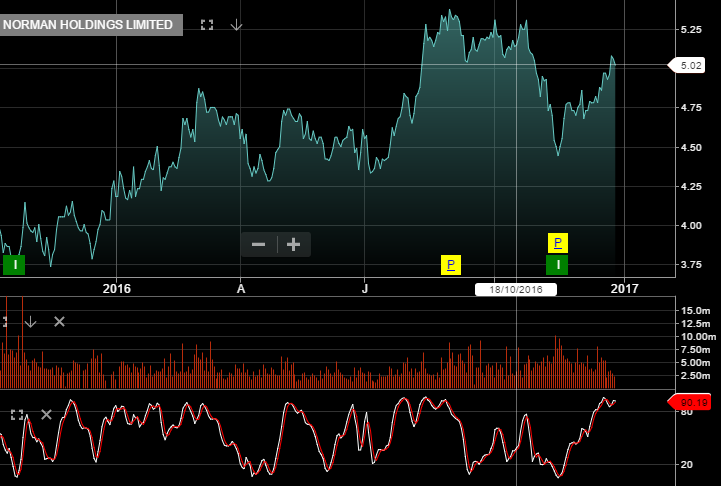
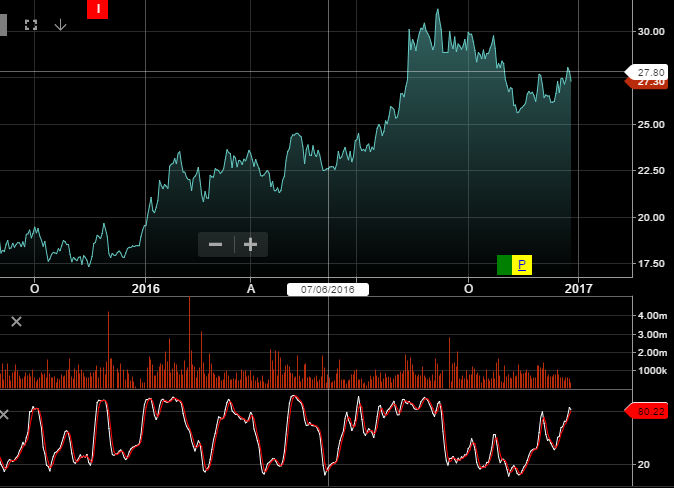
Let’s take a quick look at a few names that should prosper from the Christmas period spending activity. In the US I’ve focused on Amazon and FedEx as two relevant examples and domestically, I’ve looked at Harvey Norman and JB HI-FI.
We had buy signals from the algo engine on these names and our preference was the long position in HVN, which has now rallied 10% from the November low.
US stock Indexes closed modestly lower during Thursday’s thinly-traded preholiday session. With the lower trading volumes expected over the holiday and US Earnings season commencing in a few weeks, investors seemed reluctant to bid up prices of indexes that are already hovering near all-time highs.
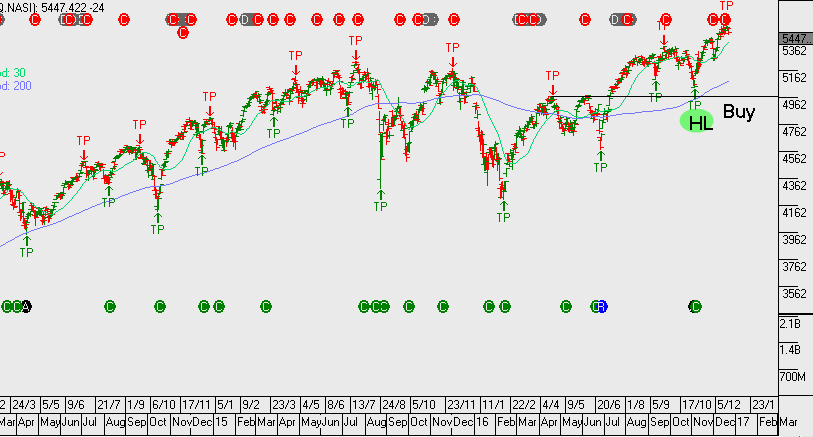
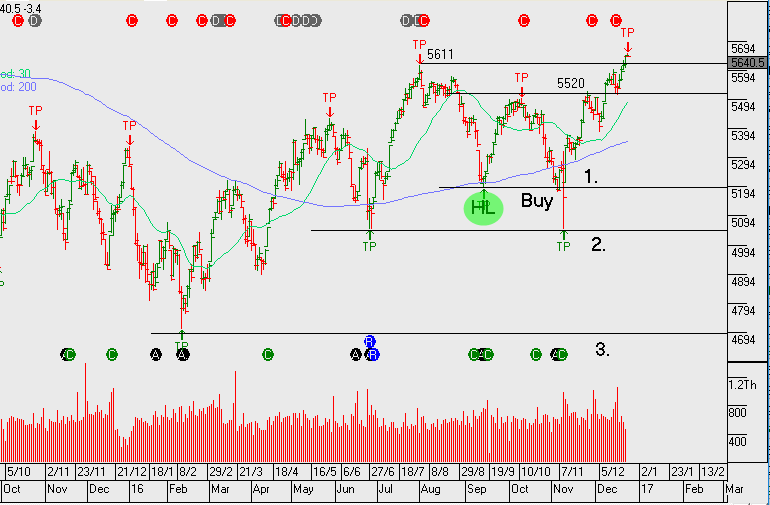
The SP 500 and the NASDAQ Composite booked their first consecutive losses in three weeks, as the post-election rally has lost momentum over the last few sessions.
It’s worth noting that since November 4th, all three of the major US Index have posted respectable gains with the Dow Jones 30 rising 11.2%, the SP 500 up 8.3% and the NASDAQ Composite gaining over 9%.
Therefore, it’s really not surprising to see stocks take a breather going into the Christmas break.