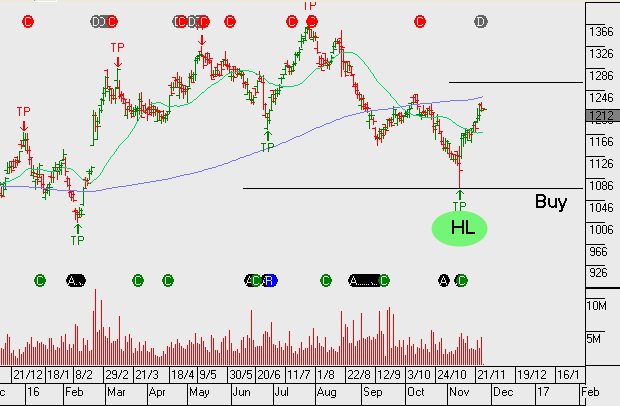
We’ve been buyers of BXB on the recent low and are now mindful the stock has rallied almost 10% from its lows and on a valuation basis the share price is likely to run into selling pressure around $12.50.
At $12.50 it places BXB on a forward yield of 2.5%, assuming management delivers 8% underlying EPS growth. From a technical perspective, the algo engine is now flagging the lower high formation which we take as a signal to either lock-in short term profits, or for longer term holders, sell covered calls to enhance the cash flow yield.
SEEK reaffirms guidance for FY17 underlying profit of A$215m-A$220m.
SEEK was able to maintain guidance for FY17 due to strong operational performance from most business units, despite unfavourable currency moves.
FY17 revenue $1.b, EBITDA $400m, EPS $0.60, DPS $0.40 places the stock a forward yield 2.8%.
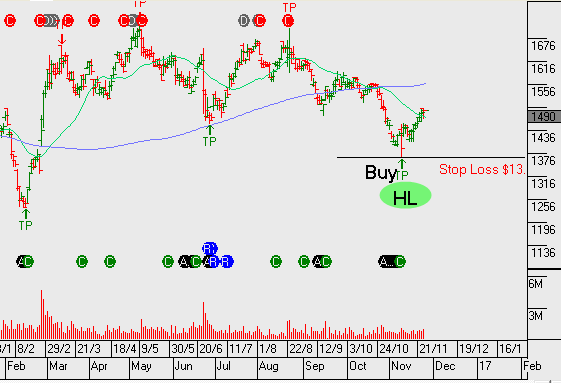
We like Seek and see upside earnings potential, however, after entering long positions at the recent low, we now look to lock-in profit ahead of anticipated resistance, at or near $15.50
We’ll revisit new entry opportunities on the next algorithm signal.
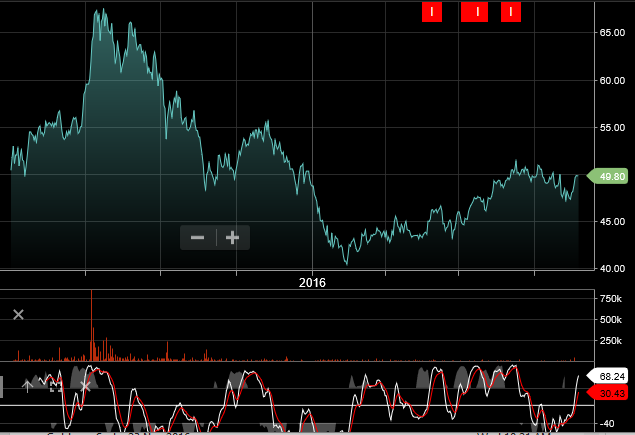
In the two weeks since the US Presidential elections, many global stock indexes have seen material gains with the Dow Jones and SP 500 posting new all-time highs. Notably absent from the list of sharply higher indexes is the the China Top 50 index. This index of China’s large capitalization stocks has moved higher over recent days, but is still 7% below the highs posted at the beginning of 2016.
We believe a combination of positive developments going into 2017 make this index represent good value at current levels. One of the biggest developments has been the revaluation of the Chinese Yuan to the US Dollar.
The weaker currency will have positive knock-on effects on next years earnings and lead to more robust investment demand, as well as escalating CPI/PPI inflation.
As such, several analysts believe consensus growth numbers are too low and will be upgraded between now and next March. In addition, the general top-down forecast for earnings growth has been lifted from 5.7% .
This upgrade stems from non-financial sales and profit margin assumptions based on higher nominal GDP and stronger capacity utilization.
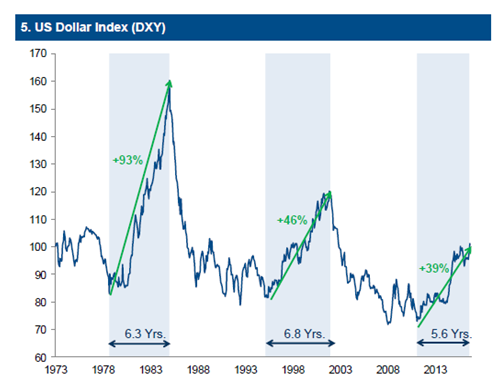
The US Dollar has had a great month of November, so far. Not only has the Greenback gained over 5% versus the Yen and 3% versus the Euro, but the USD Index has recorded its best two-week performance in 20 years. The USD Index has traded higher for ten consecutive sessions and gained just over 4.25% to reach the highest level since 2003 at 101.25.
Investors are anticipating a very pro-business bias from the new US administration, featuring across the board tax cuts, deregulation and a comprehensive infrastructure stimulus package. However, the inauguration of President Trump is still more than two months away and it’s reasonable to expect the USD, US Stocks and US yields to take pause after the recent rallies.