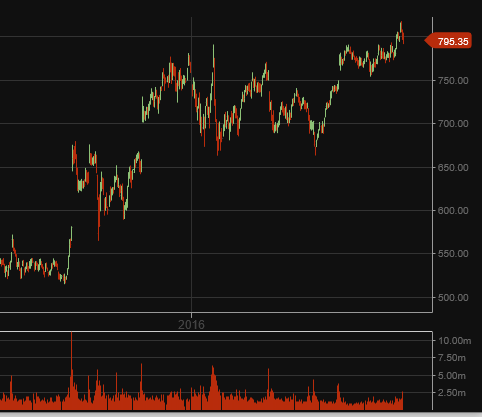
Shares of Alphabet, the parent company of Google, are down over 4% in aftermarket trade even thought the company beat Q3 earnings expectations.
The search engine conglomerate posted Q3 earnings of $9.06 per share, adjusted, on revenue of $22.45 billion. Analysts were expecting the company to report earnings of $8.63 per share on revenue of $22.05 billion.
Today’s results compare to $7.35 per share, with revenue up 20% from last year’s $18.68 billion. The company also announced the approval of a buy-back of over $7 billion of its Class C shares over the next three months.
The share price initially spiked higher, posting a new high for the year at $837.35, before reversing back below $820.00 in after hours trade.
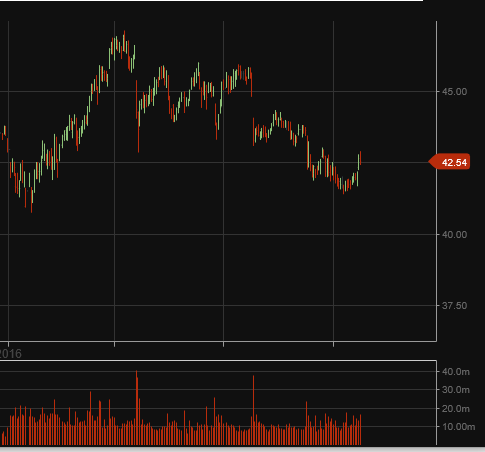
Shares of Coca-Cola dropped slightly to 42.50 on weaker year-on-year profit guidance even though Q3 earnings were slightly higher.
The beverage maker announced a profit of $1.05 billion, or 24 cents per share, down from $1.45 billion, or 33 cents per share in Q3 2015. Excluding one-off tax items, per share earnings were 49 cents per share, while revenue declined 6.9% to $10.63 billion.
Analysts had forecast adjusted earnings of 40 cents on revenue of $10.51 billion. It was the seventh straight quarter that the firm beat expectations; if only slightly. However, when announcing their 2017 guidance, the company warned of a potential 4% to 7% decline in comparable earnings over the medium-term.
This negative guidance gives scope for a pullback in the share price to the $40.00 area last seen in January of this year.
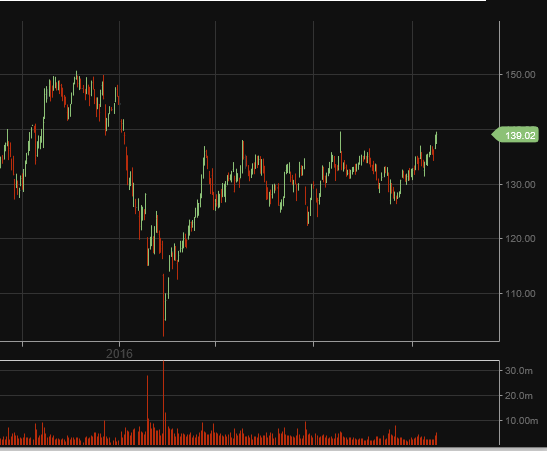
Boeing shares jumped over 4% to post a new high for the year at $148.00 as the company beat expectations for Q3 earnings.
Despite a decline in revenue, the aircraft manufacturer said earnings rose to $2.28 billion, or $3.60 per share, from $1.70 billion, or $2.47 per share during Q3 2015. Core earnings, which exclude some pension and other costs, rose to $3.51 per share from $2.52 a year ago.
Both figures include a special gain of 70 cents per share, reflecting a tax benefit Boeing received by claiming depreciation on plants and equipment.
Positive forward guidance brought in longer term buyers as the company raised its target for jetliner deliveries for the year to 750 from 740 and lifted its year-end revenue estimate to 95.5 billion from 93.5 billion.
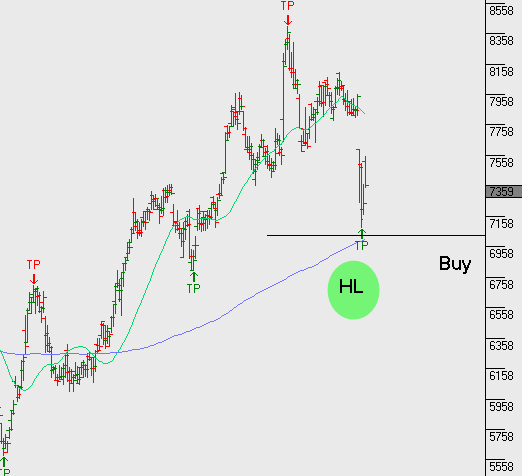
Ramsay 1Q17 earnings results were in line with market expectations and the company reaffirmed core NPAT and EPS growth should be in the range of 10-12% for FY17.
RHC.ASX should start to build support at or near $70, upside is limited and covered calls should be used to enhance the yield.
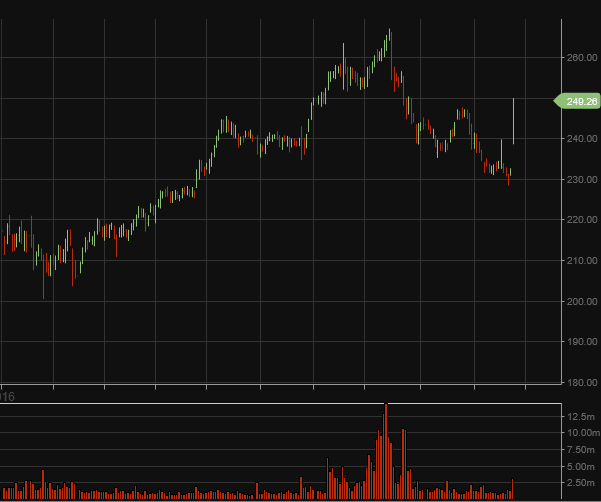
Shares of Lockheed Martin closed 5% higher at $243.00 after the defense contractor beat Q3 earnings expectations.
The company reported adjusted earnings of $3.61 per share, well above the consensus of $2.89 per share. It reported sales of $11.55 billion, up from $10.06 billion in the year earlier period and above the consensus of $11.45 billion.
Lockheed said it expects overall 2016 earnings per share of $12.10 and sales of $46.5 billion, as adjusted for divested business. The company expects ongoing operations to lift 2017 net sales by 7%.
The strong price response was welcomed as shares of Lockheed have fallen 9% in the last three months from the August high of $264.00.
The price of Apple shares traded in a wide range after the company reported slightly better earnings but the lower quarterly results marked the third quarter of year-over-year revenue declines.
The iPhone maker reported earnings of $1.67 per share, just above the $1.66 expected consensus. Revenues came in at $46.90 billion, just shy of the 46.94 billion expected. That’s down from the comparable figure of $1.96 per share on sales of $51.5 billion a year ago.
Apple shares rose briefly to $119.00 in after hours trading, but were last seen down more than 2% and dipping below the mid-September support area at $115.00. The company reported that it shipped 44.8 million iPhones, which is down from 48.04 million a year ago.
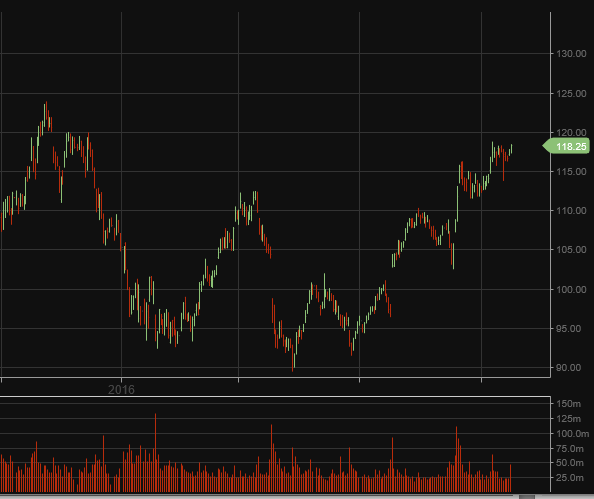
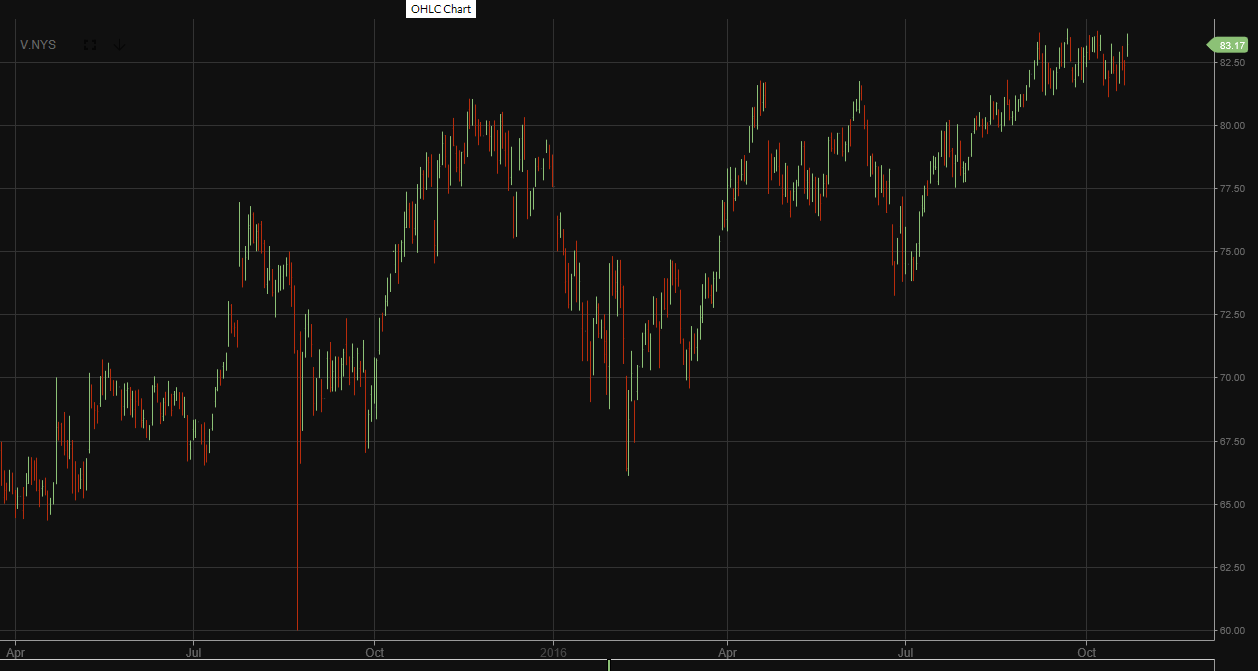
Shares of Visa Corporation were down over 1% in after hours trade after a solid earnings report was followed by weak 2017 guidance.
The credit card provider beat Q4 forecasts of 68 cents by announcing an 18% rise in earnings to 73 cents per share. Q4 revenue increased by 15% to $4.23 billion against the same period in 2015. The better-than-expected Q4 growth was helped by its acquisition of Visa Europe.
However, fiscal 2017 adjusted earnings per share growth was estimated at just over 15% versus a consensus for a 19% increase, which pushed the stock lower. The September low of 81.30 will offer the first key support level.
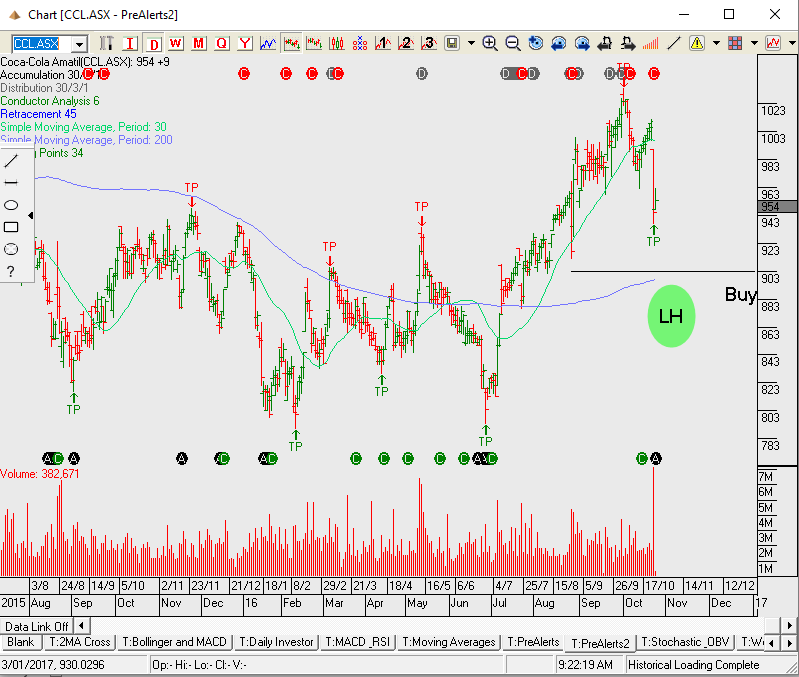
CCL has it challenges as consumer trends continue to move away from large volume consumption of carbonated sugar drinks. CCL is responding through new product ranges and reducing the size of both cans and bottles.
$100m in cost savings along with automation and efficiency gains in the production facilities will help to offset any revenue weakness. Our base case for CCL on a 12 to 24 month outlook is for relatively flat revenue and EPS growth.
FY17 revenue $5.2b, EBIT $680m, EPS $0.55, DPS $0.45 places the stock on a forward yield of 4.8% and a PE ratio of 17x.
We’ve been active in selling covered calls over CCL as we’ve maintained full value is around $9.50. Keep CCL on your radar as a pull back to $9.00 is worth considering as an entry point to buy the stock. We think CCL trades in a consolidation channel over the next 12 months. A combination of the dividend and option premium produces 10% annualised cash flow.
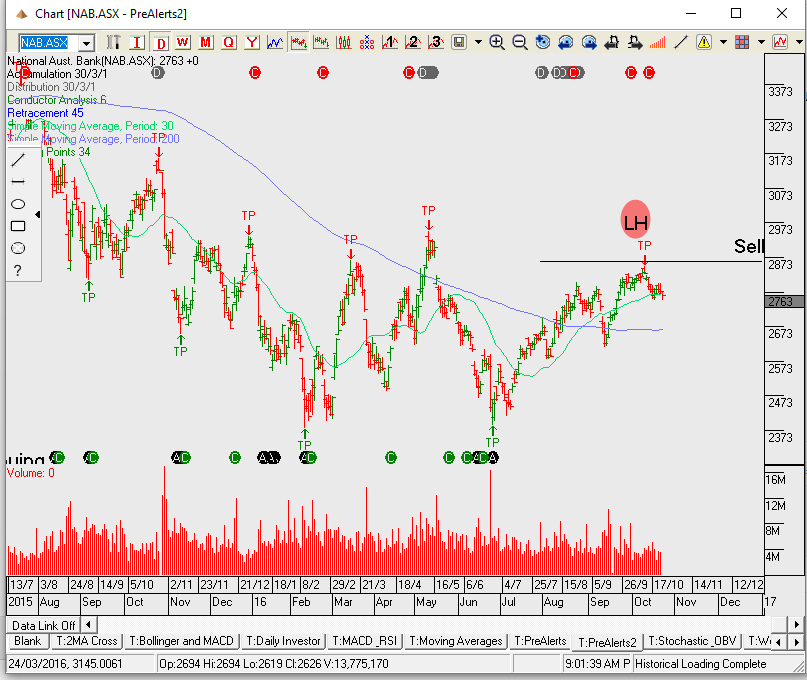
NAB is scheduled to report its FY16 result on Thursday and we’re expecting FY16 cash earnings of $6.4b. The final dividend will likely be around $0.98 fully franked & we continue to expect the dividend to be cut next year.
We are forecasting a 2H16 credit impairment charge of $500m which is an increase of $125m on the 1H16 number.
Based on a slight reduction in dividends the FY18 yield is 6.75%.
Selling covered calls at or near $28.50 into early next year, with a view towards collecting the upcoming dividend is our preferred strategy.
The USD ended on a firm note last week as foreign exchange traders were focused on the divergence of monetary policy between the Greenback and the other G-7 currencies. Over the last several trading sessions, we learned that European Central bank is still open to more stimulus in December, the Australian economy is not as vibrant as the RBA suggests and that the Reserve Bank of New Zealand is thinking about easing again before the end of the year. We also learned that the U.K. economy is slowing at a time when US growth aggregates have been posting mostly stronger numbers for employment, housing and retail spending.
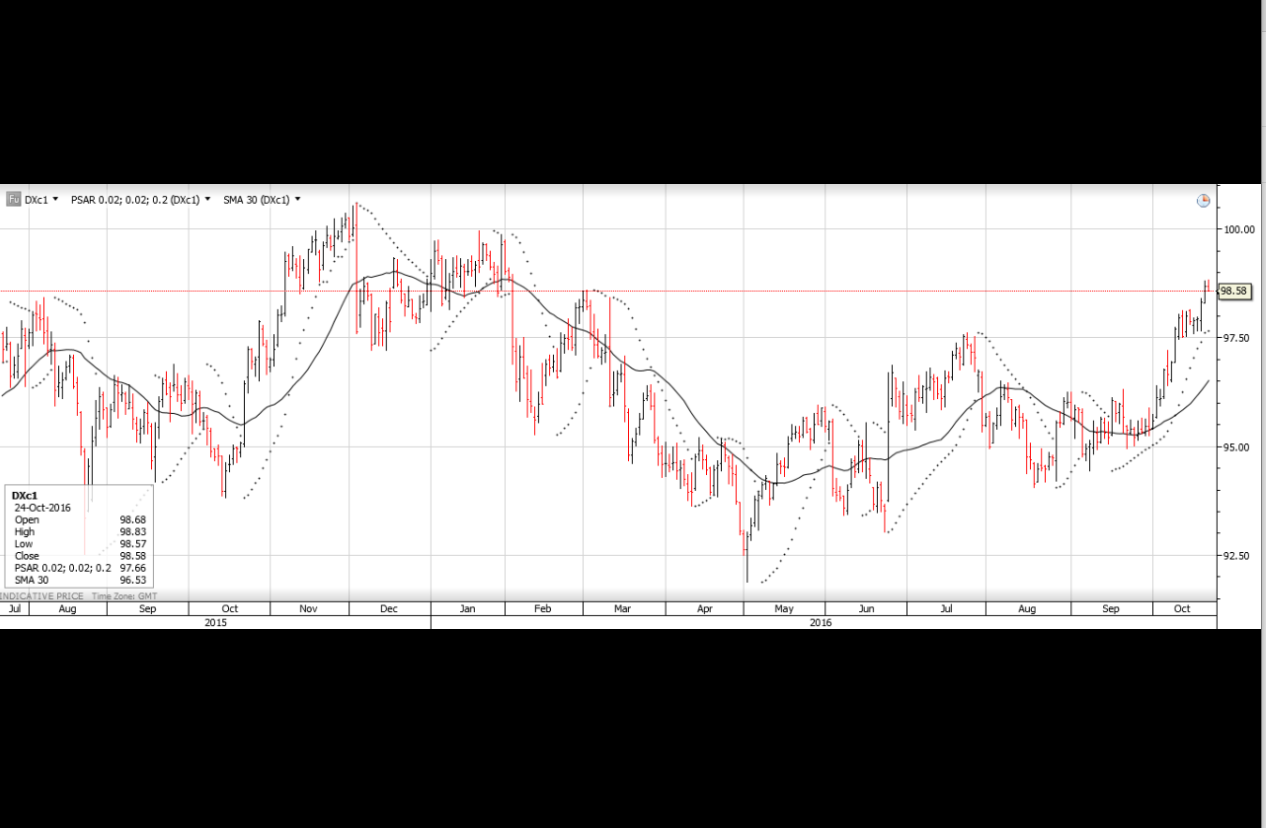
The steady flow of generally hawkish comments from FOMC officials stands in contrast to the dovish language coming from other central banks and has helped the USD Index reach an eight-month high just short of 99.00 at Friday’s NY close. It’s our base case that the likelihood for further interest rate normalization will increase over the next few weeks which will support the USD, keep the SP 500 index in a “buy on the dip” pattern and lift 10-year treasury yields back into the 1.95% area
With only a few first-tier fundamental data points scheduled for this week, It’s worth looking at some of the technical price patterns which have emerged over the last several trading sessions. The most prominent technical pattern is the “Golden Cross” in the USD Index. A Golden cross is formed when the 50-day moving average crosses above the 200-day moving average and suggests a continuation to higher levels. We note that the last time this pattern emerged, the USD actually consolidated for a couple of weeks before moving higher. With US Durable Goods orders scheduled for Thursday and GDP to be released on Friday, the consolidation phase could be much shorter this time.
Since the Euro currency makes up close to 58% of the weighting of the USD Index, it’s not surprising that the same moving average time frames have crossed to the downside in the EUR/USD. This pattern is called the “Deadman’s Cross” and suggests last week’s break of the July trend line will see downside range extension this week.
Chart USD Index
Sophisticated Investor?
We have special opportunities available for Sophisticated Investors. If you're interested, and qualify, please provide your details below.